Foreign Exchange Intervention Rules for Central Banks: A Risk-Based Framework#
This notebook replicates the tables and the charts of the IMF WP on Foreign Exchange Intervention Rules for Central Banks: A Ris-Based Framework
It uses a Python package that I have written, DistGARCH, also available in this Github folder, with the public FX intervention data from the Banco Mexico. DistGARCH is based on the ARCH package of Kevin Sheppard.
You can use the code for non-commercial applications, providing that you cite the IMF Working Paper
Lafarguette, R. and Veyrune, R. (2021) Foreign Exchange Intervention Rules for Central Banks: A Ris-Based Framework,
IMF Working Paper no 2021032 https://www.imf.org/en/Publications/WP/Issues/2021/02/12/Foreign-Exchange-Intervention-Rules-for-Central-Banks-A-Risk-based-Framework-50081
Author: Romain Lafarguette, June 2021 If you have any question, please contact me via Github or rlafarguette “at” imf “dot” org
Preamble#
# System paths
import os, sys

# Global modules
import importlib                                        # Operating system
import pandas as pd                                     # Dataframes
import numpy as np                                      # Numeric Python
import datetime                                         # Dates
import arch                                             # ARCH/GARCH models

# Functional imports
from datetime import datetime as date                   # Short date function
from dateutil.relativedelta import relativedelta        # Dates manipulation

# ARCH package functional imports
from arch.univariate import (ARCH, GARCH, EGARCH, EWMAVariance, # Vol process
                             FixedVariance, RiskMetrics2006)
from arch.univariate import (Normal, StudentsT, # Distribution of residuals
                             SkewStudent, GeneralizedError)

# Local modules
from varfxi.quantileproj import QuantileProj
from varfxi.distGARCH import DistGARCH

# Graphics
import matplotlib.pyplot as plt                         # Graphical package
import seaborn as sns                                   # Graphical tools

# Graphics options
plt.rcParams["figure.figsize"] = 25,15
#plt.rcParams["figure.dpi"] = 600
sns.set(style='white', font_scale=4, palette='deep', font='serif')

# Pandas options
pd.set_option('display.max_rows', 50)
pd.set_option('display.max_columns', 10)

# Warnings management
import warnings
warnings.filterwarnings("ignore")

data_folder = "./data/"
output_folder = "./output/"
def logret(series):
    return(np.log(series/series.shift(1)))
Figure 1: Conditional VaR and density (diagram)#

# Read the data for Mexico
macro_p = os.path.join(data_folder, 'macro_data.csv')
dm = pd.read_csv(macro_p, parse_dates=['date'], index_col=['date'])
inter_p = os.path.join(data_folder, 'intervention_data.csv')
di = pd.read_csv(inter_p, parse_dates=['date'], index_col=['date'])
df = pd.merge(dm, di, on=['date'], how='left').sort_index().copy() # Merge
df = df[~df.index.duplicated()].copy() # Duplicated index
df.head()
| mxn_usd_spot | mxn_fwd_1m | min_max_spread | bid_ask_spread | mxn_interbank_1m | ... | eur_usd_spot | amount | direction | type | sell_amount | |
|---|---|---|---|---|---|---|---|---|---|---|---|
| date | |||||||||||
| 1990-01-01 | 2.6835 | NaN | 0.000 | 0.0 | NaN | ... | NaN | NaN | NaN | NaN | NaN |
| 1990-01-02 | 2.6770 | NaN | 0.007 | 0.0 | NaN | ... | NaN | NaN | NaN | NaN | NaN |
| 1990-01-03 | 2.6770 | NaN | 0.000 | 0.0 | NaN | ... | NaN | NaN | NaN | NaN | NaN |
| 1990-01-04 | 2.6770 | NaN | 0.000 | 0.0 | NaN | ... | NaN | NaN | NaN | NaN | NaN |
| 1990-01-05 | 2.6770 | NaN | 0.000 | 0.0 | NaN | ... | NaN | NaN | NaN | NaN | NaN |
5 rows × 15 columns
# New macro variables
df['FX level'] = df['mxn_usd_spot'].copy()
df['FX log returns'] = 1e4*logret(df['mxn_usd_spot'])
df['Bid ask abs'] = np.abs(df['bid_ask_spread'])
df['Min max abs'] = np.abs(df['min_max_spread'])
df['Forward points first difference'] = df['mxn_fwd_1m'].diff(1)/1e2
df['Interbank rate vs Libor'] = (df['mxn_interbank_1m'] - df['usa_libor_1m']).diff(1)
df['VIX first diff'] = df['vix'].diff(1)
df['EURUSD log returns'] = 1e4*logret(df['eur_usd_spot'])
df['Oil prices log returns'] = 1e4*logret(df['oil_prices'])
# FX intervention variables
df['FX intervention in USD'] = df['sell_amount'].fillna(0)
df['fx_intervention_minprice'] = df.loc[df['type']=='min price',
                                        'sell_amount'].fillna(0)
df['fx_intervention_nominprice'] = df.loc[df['type']=='no min price',
                                          'sell_amount'].fillna(0)
df['FX intervention dummy'] = 0
df.loc[df['FX intervention in USD'] > 0, 'FX intervention dummy'] = 1
df['FX intervention dummy lag'] = df['FX intervention dummy'].shift(1)
df['Intercept'] = 1

df['FX log returns_fwd'] = df['FX log returns'].shift(-1)

clean_p = os.path.join(data_folder, 'clean_data.csv')
df.to_csv(clean_p,index=True)
Fit the GARCH model for different specifications#
# Prepare the list of variables
microstructure = ['Bid ask abs',
                  'Min max abs',
                  'Forward points first difference']

cip = microstructure + ['Interbank rate vs Libor']

eurusd = cip + ['EURUSD log returns']

vix = eurusd + ['VIX first diff']

baseline = vix + ['Oil prices log returns', 'FX intervention dummy lag']

# List of models
models_l = [microstructure, cip, eurusd, vix, baseline]
labels_l = ['Microstructure', 'CIP', 'Dollar move', 'Risk Appetite','Baseline']
Baseline GARCH Model: Fit and Forecast#
Specify the model#
dg = DistGARCH(depvar_str='FX log returns',
               data=df,
               level_str='FX level',
               exog_l=baseline, # Defined above
               lags_l=[1],
               vol_model=GARCH(1,1,1),
               # ARCH(1,1), EGARCH(1,1,1), GARCH(1,1),
               # EWMAVariance(None), RiskMetrics2006(),
               dist_family=Normal(),
               # Normal(), StudentsT(), SkewStudent(), GeneralizedError()
)
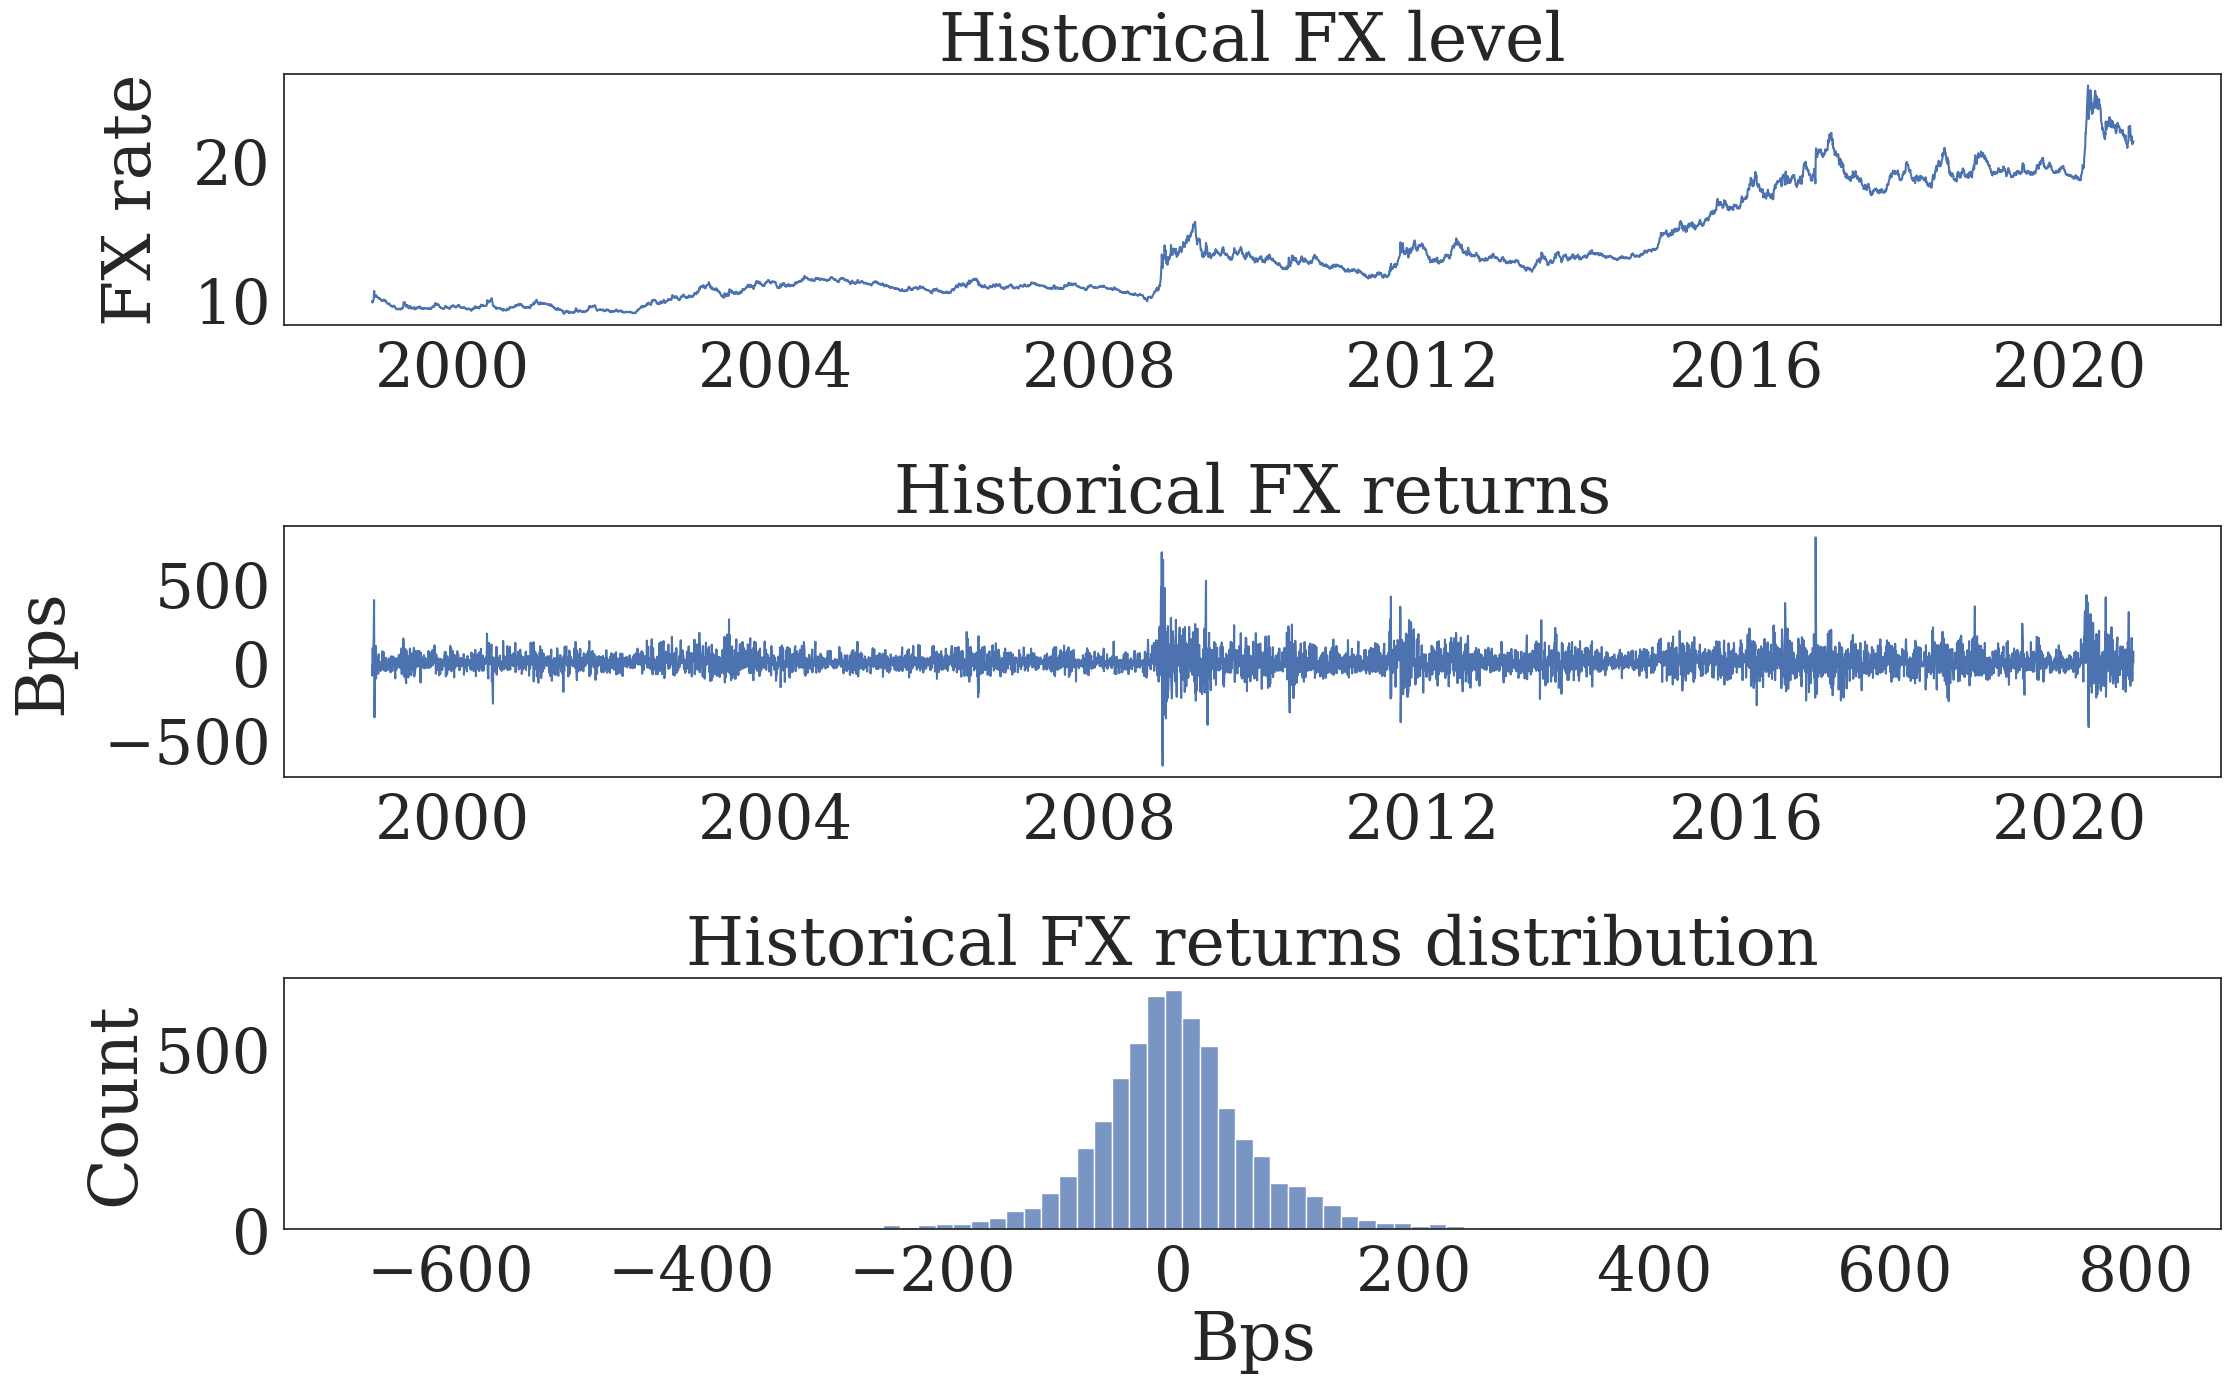
Figure 2. Mexican Peso Against US Dollar#
# Plot
dg.plot.plot_description(title_level='Historical FX level',
                    title_returns='Historical FX returns',
                    title_density='Historical FX returns distribution',
                    y_label_returns='Bps')
plt.subplots_adjust(hspace=0.8)

# Save the figure
desc_f = os.path.join(output_folder, 'descriptive_plot.pdf')
plt.savefig(desc_f, bbox_inches='tight')
plt.show()
plt.close('all')
Fit the Model#
# Fit the model
dgf = dg.fit()
                        AR-X - GJR-GARCH Model Results
==============================================================================
Dep. Variable:         FX log returns   R-squared:                       0.279
Mean Model:                      AR-X   Adj. R-squared:                  0.277
Vol Model:                  GJR-GARCH   Log-Likelihood:               -30558.5
Distribution:                  Normal   AIC:                           61145.0
Method:            Maximum Likelihood   BIC:                           61238.0
                                        No. Observations:                 5680
Date:                Sat, Apr 15 2023   Df Residuals:                     5670
Time:                        10:13:36   Df Model:                           10
                                             Mean Model
===================================================================================================
                                      coef    std err          t      P>|t|        95.0% Conf. Int.
---------------------------------------------------------------------------------------------------
Const                              -5.1248      1.580     -3.243  1.184e-03       [ -8.222, -2.027]
FX l...rns[1]                      -0.0839  1.493e-02     -5.624  1.869e-08    [ -0.113,-5.469e-02]
Bid ask abs                       -53.8687     49.136     -1.096      0.273    [-1.502e+02, 42.437]
Min max abs                        68.0834     18.264      3.728  1.932e-04     [ 32.287,1.039e+02]
Forward points first difference    20.7775      2.411      8.618  6.785e-18       [ 16.052, 25.503]
Interbank rate vs Libor            38.7427      6.567      5.900  3.645e-09       [ 25.871, 51.614]
EURUSD log returns                 -0.1527  1.417e-02    -10.779  4.318e-27       [ -0.180, -0.125]
VIX first diff                     15.0417      0.669     22.485 5.814e-112       [ 13.731, 16.353]
Oil prices log returns             -0.0193  3.425e-03     -5.648  1.626e-08 [-2.605e-02,-1.263e-02]
FX intervention dummy lag          -0.9542      4.814     -0.198      0.843       [-10.389,  8.481]
                               Volatility Model
==============================================================================
                 coef    std err          t      P>|t|        95.0% Conf. Int.
------------------------------------------------------------------------------
omega         30.7491     10.696      2.875  4.042e-03       [  9.786, 51.713]
alpha[1]       0.1129  1.927e-02      5.860  4.630e-09     [7.513e-02,  0.151]
gamma[1]      -0.0645  1.451e-02     -4.447  8.689e-06 [-9.295e-02,-3.608e-02]
beta[1]        0.9147  1.562e-02     58.563      0.000       [  0.884,  0.945]
==============================================================================

Covariance estimator: robust
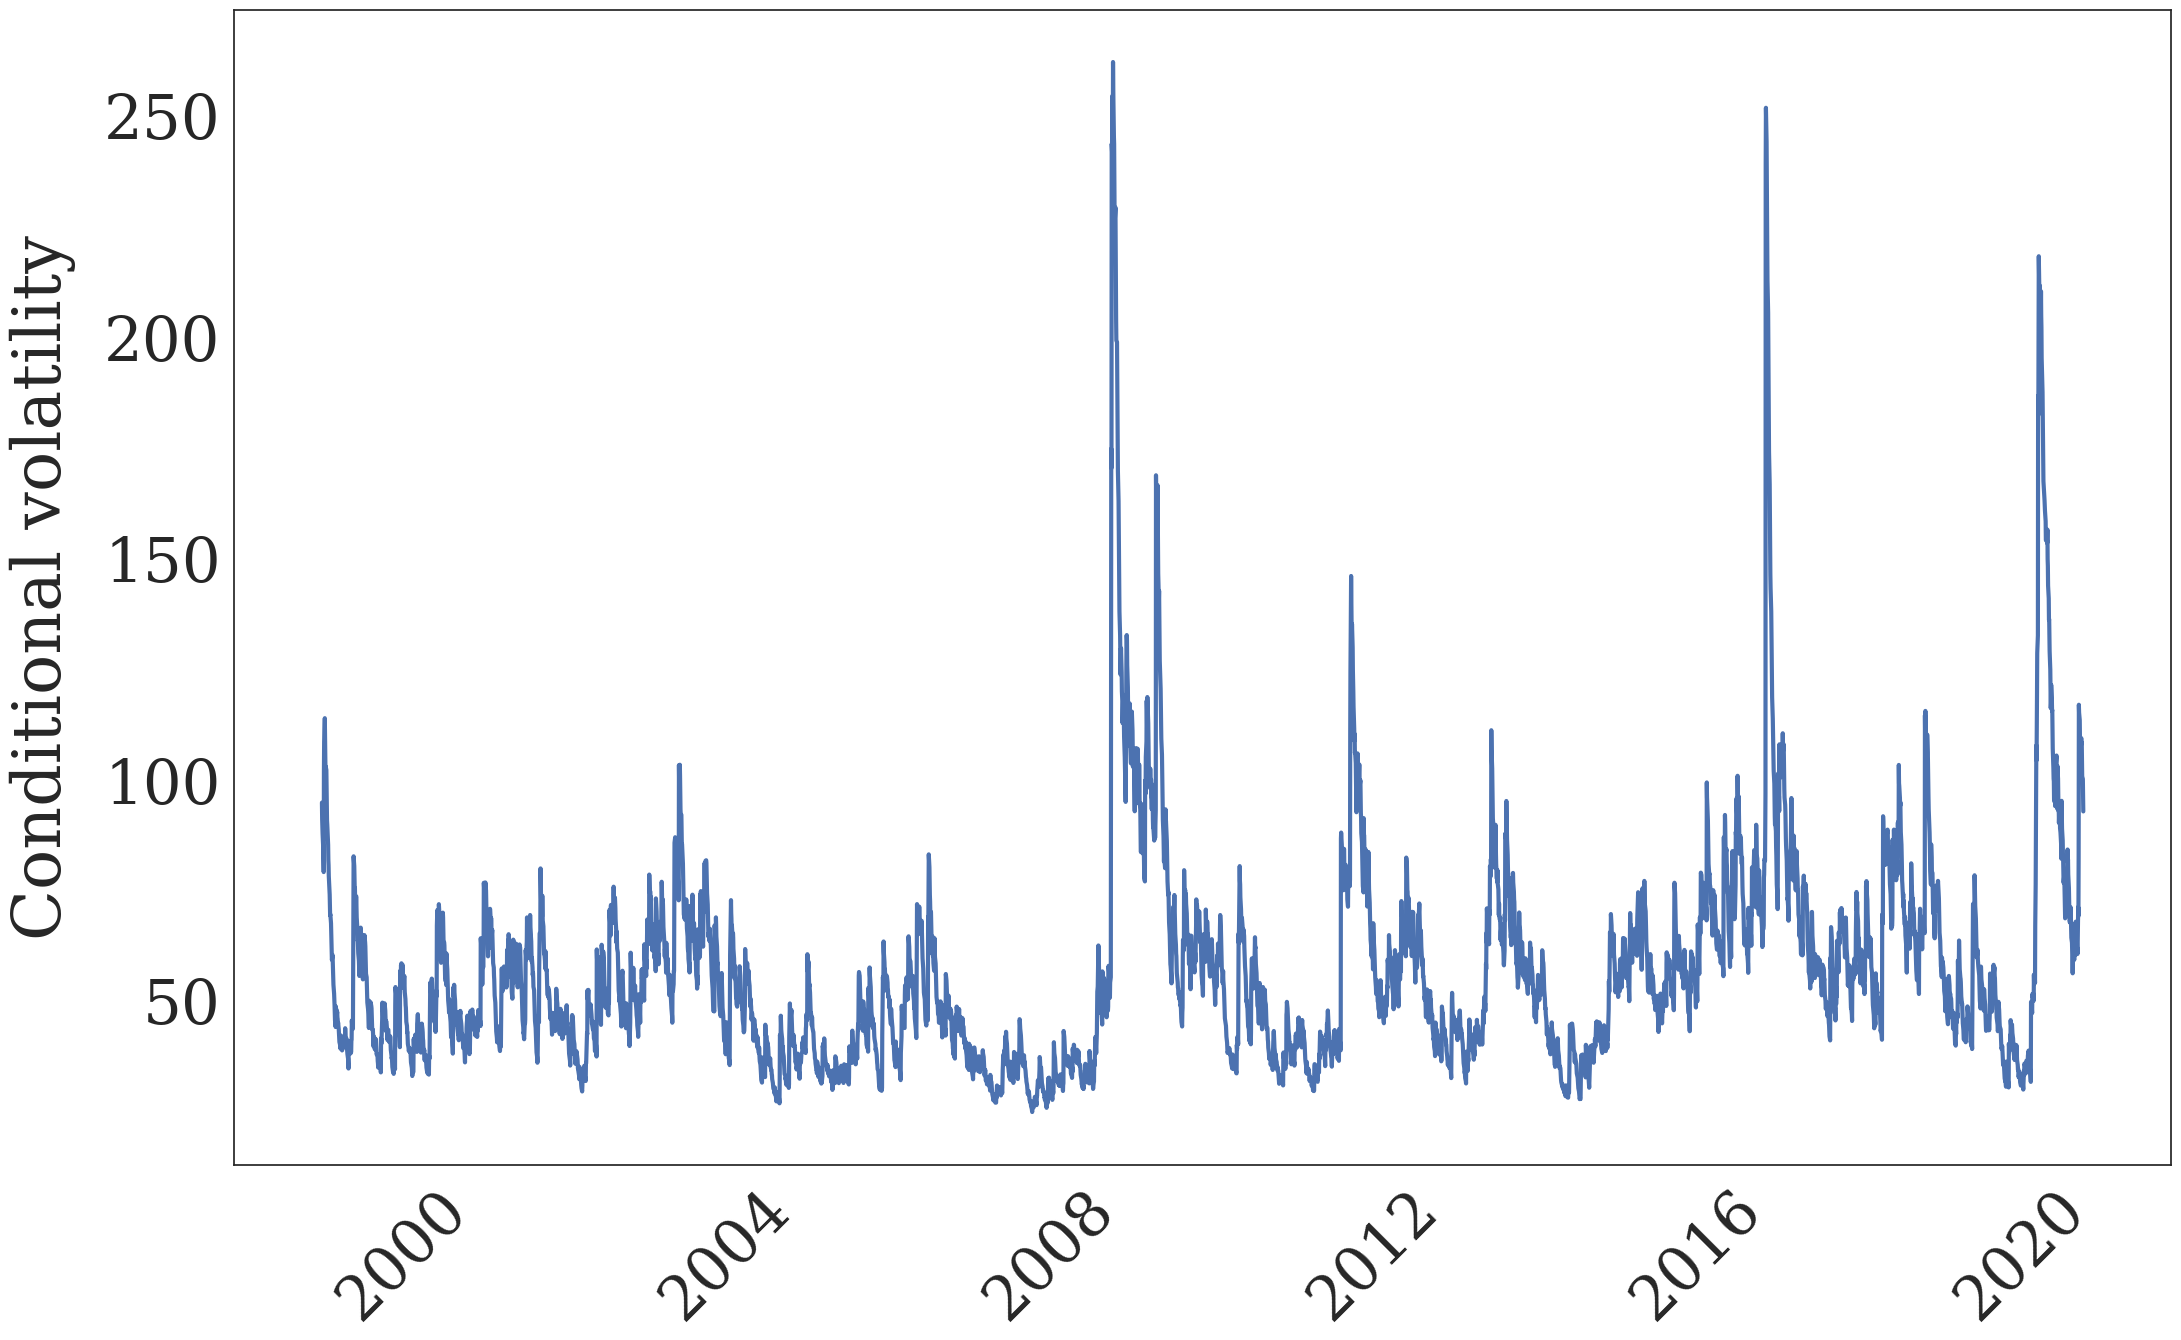
Figure 3. Conditional FX Volatility Over Time#
# Plot
dgf.plot.plot_in_cond_vol(start_date=None,
                     title='')
# Save the figure
cv_f = os.path.join(output_folder, 'conditional_vol_plot.pdf')
plt.savefig(cv_f, bbox_inches='tight')
plt.show()
plt.close('all')
# Plot
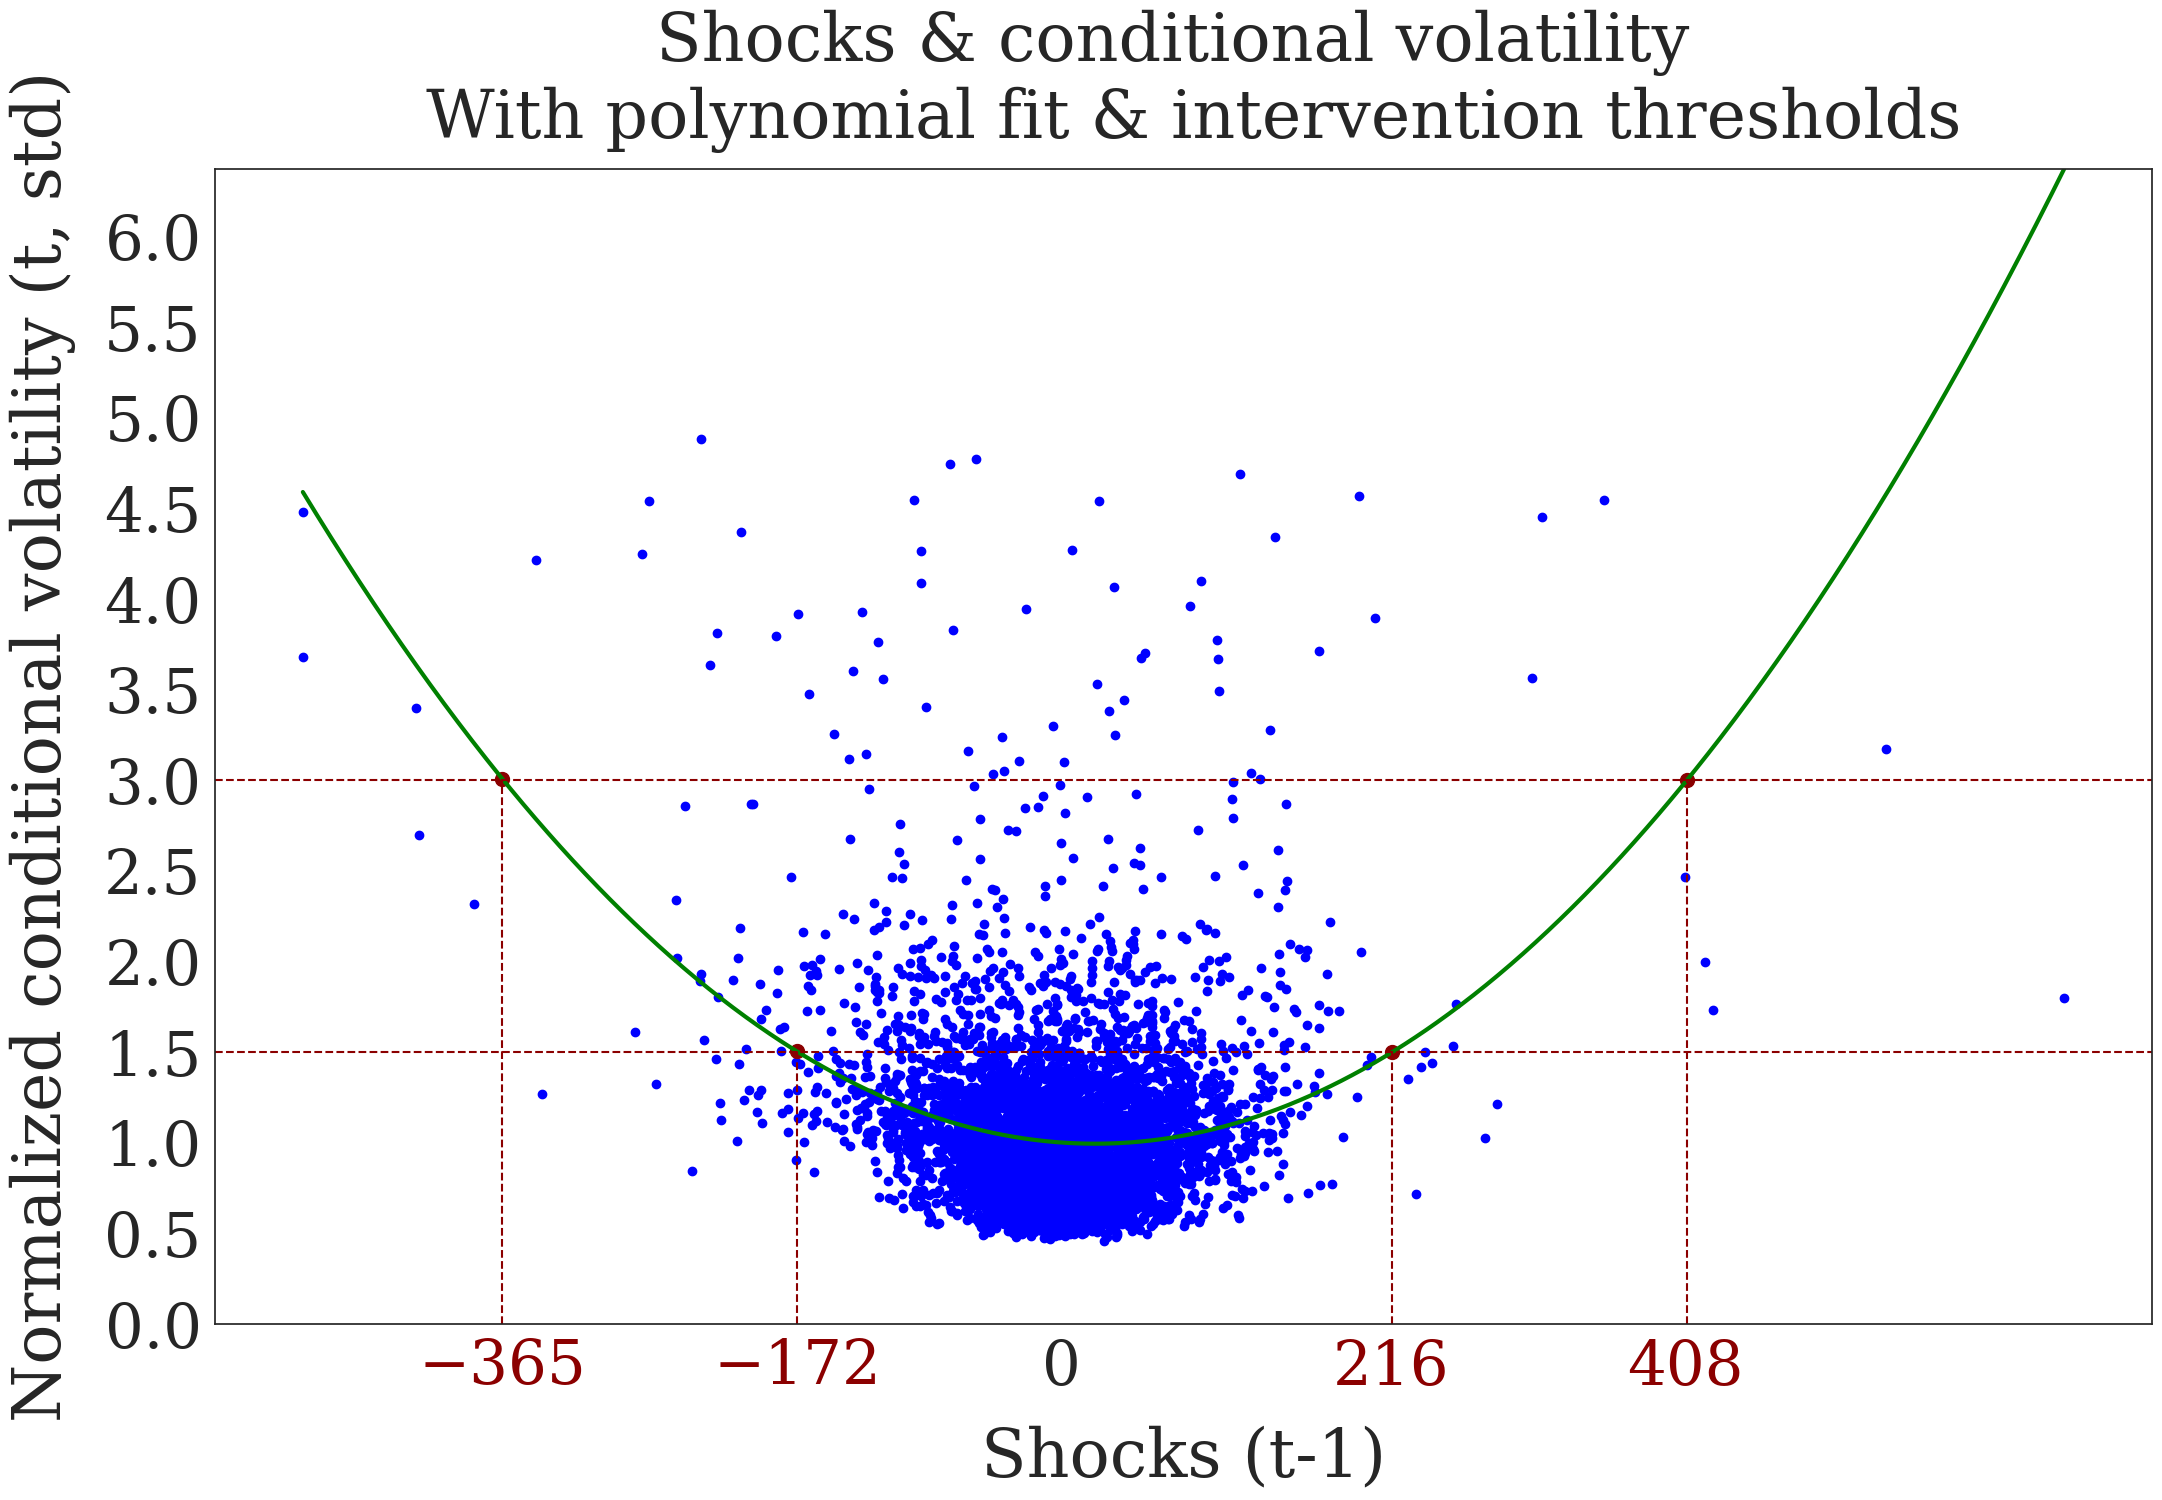
dgf.plot.plot_shocks_vol()
# Save the figure
sv_f = os.path.join(output_folder, 'shock_vol.pdf')
plt.savefig(sv_f, bbox_inches='tight')
plt.show()
plt.close('all')
<Figure size 2500x1500 with 0 Axes>
Forecast the model#
# Forecast 2020
dgfor = dgf.forecast('2020-01-01', horizon=1)
Figure 4. Out-of-sample Conditional Density (Joyplot)#
# Plot
dgfor.plot.plot_joyplot_out(
    title='',
    xlabel='',
    label_drop=15,
    xlimits_t=(-1000, 1000))

# Save the figure
joyplot_f = os.path.join(output_folder, 'joyplot.pdf')
plt.savefig(joyplot_f)
plt.show()
plt.close('all')
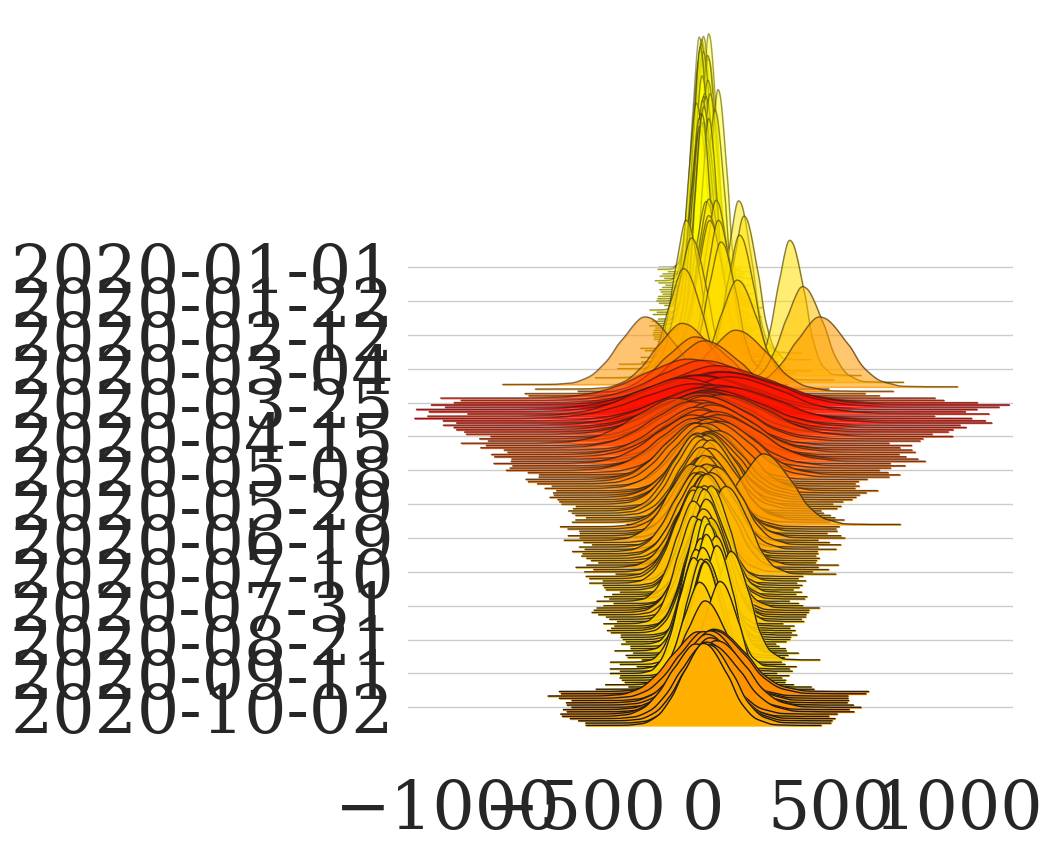
Figure 5. Out-of-Sample Fan Chart#
# Plot
dgfor.plot.plot_fan_chart(xticks_freq=35, title='Fan chart of predictive FX log returns \n'
                     '(1, 5, 10, 25, 75, 90, 95th conditional quantiles)')
plt.ylabel('Pips')

# Save the figure
fanchart_f = os.path.join(output_folder, 'fanchart.pdf')
plt.savefig(fanchart_f, bbox_inches='tight')
plt.show()
plt.close('all')
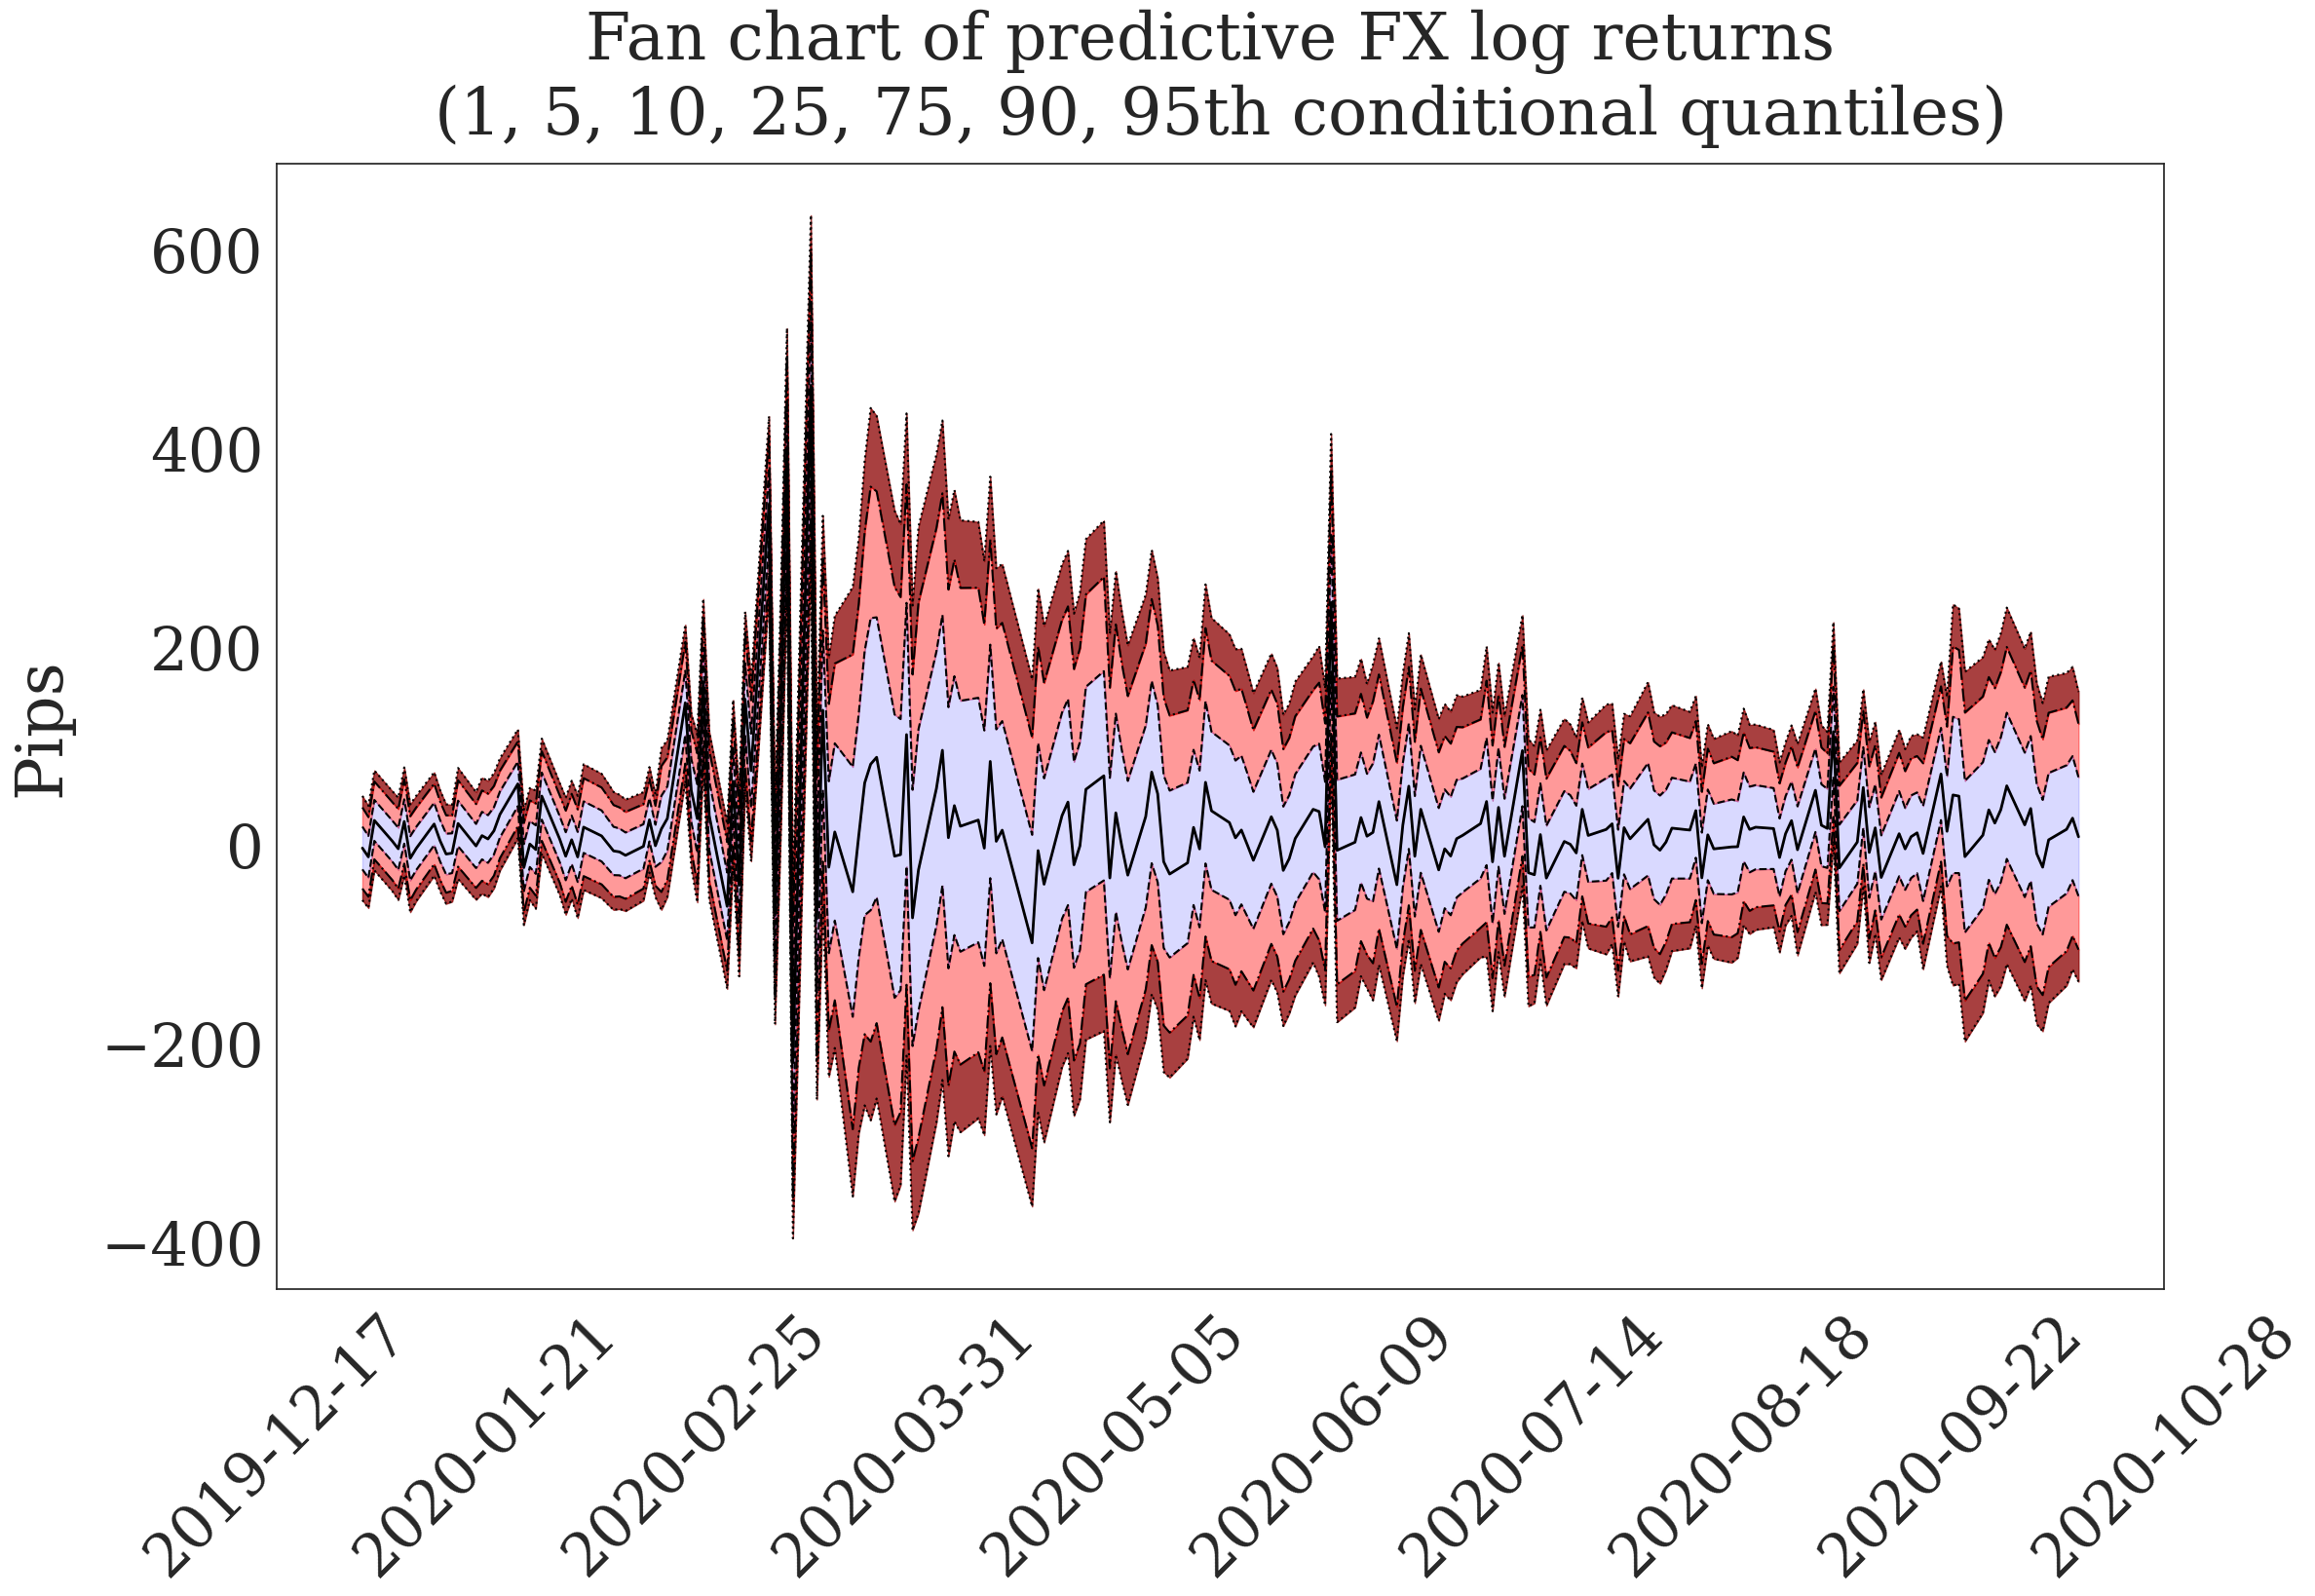
Figure 6. Probability Integral Transform Test#
# Plot
dgfor.plot.plot_pit()
# Save the figure
pitchart_f = os.path.join(output_folder, 'pitchart.pdf')
plt.savefig(pitchart_f, bbox_inches='tight')
plt.show
plt.close('all')
dgfor.plot.plot_qqplot_normalized_innovations()
# Save the figure
qqchart_f = os.path.join(output_folder, 'qqplot.pdf')
plt.savefig(pitchart_f, bbox_inches='tight')
plt.show()
plt.close('all')
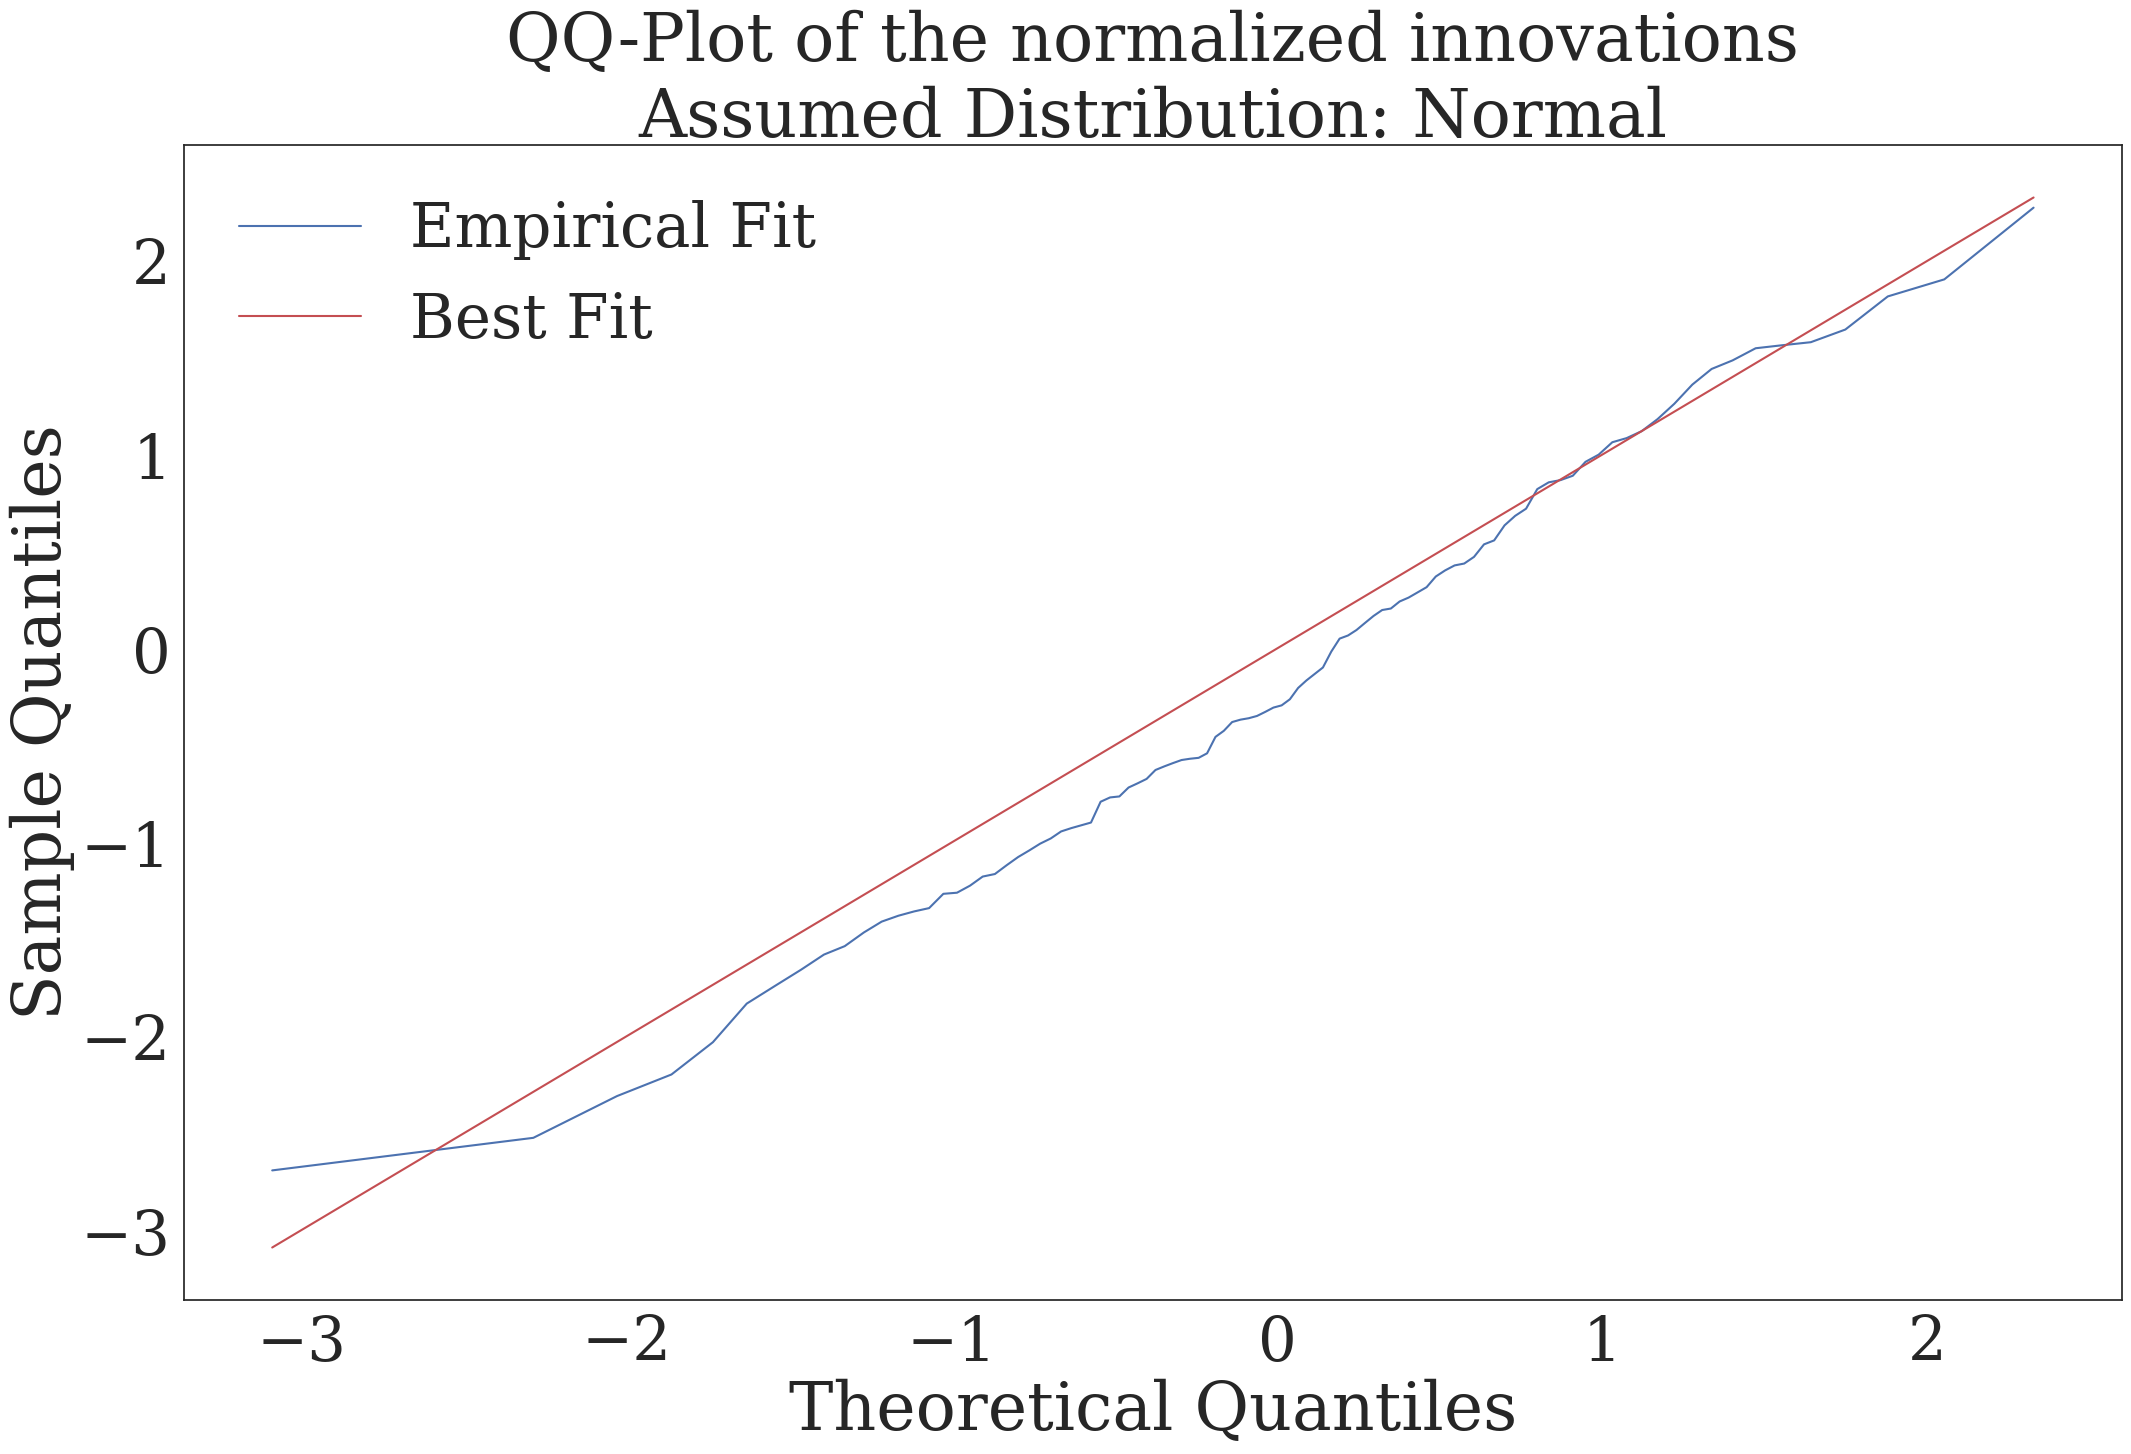
Figure 7. VaR FX Interventions Rule Based on a Given Information Set#
# Plot
dgfor.plot.plot_pdf_rule(fdate='2020-05-01', q_low=0.025, q_high=0.975,
                    title='Conditional Density and Intervention Rule Based on 2020-05-01 Information',
                    ylabel='Density', xlabel='Bps')

# Save the figure
var_rule_f = os.path.join(output_folder, 'var_rule.pdf')
plt.savefig(var_rule_f, bbox_inches='tight')
plt.show()
plt.close('all')
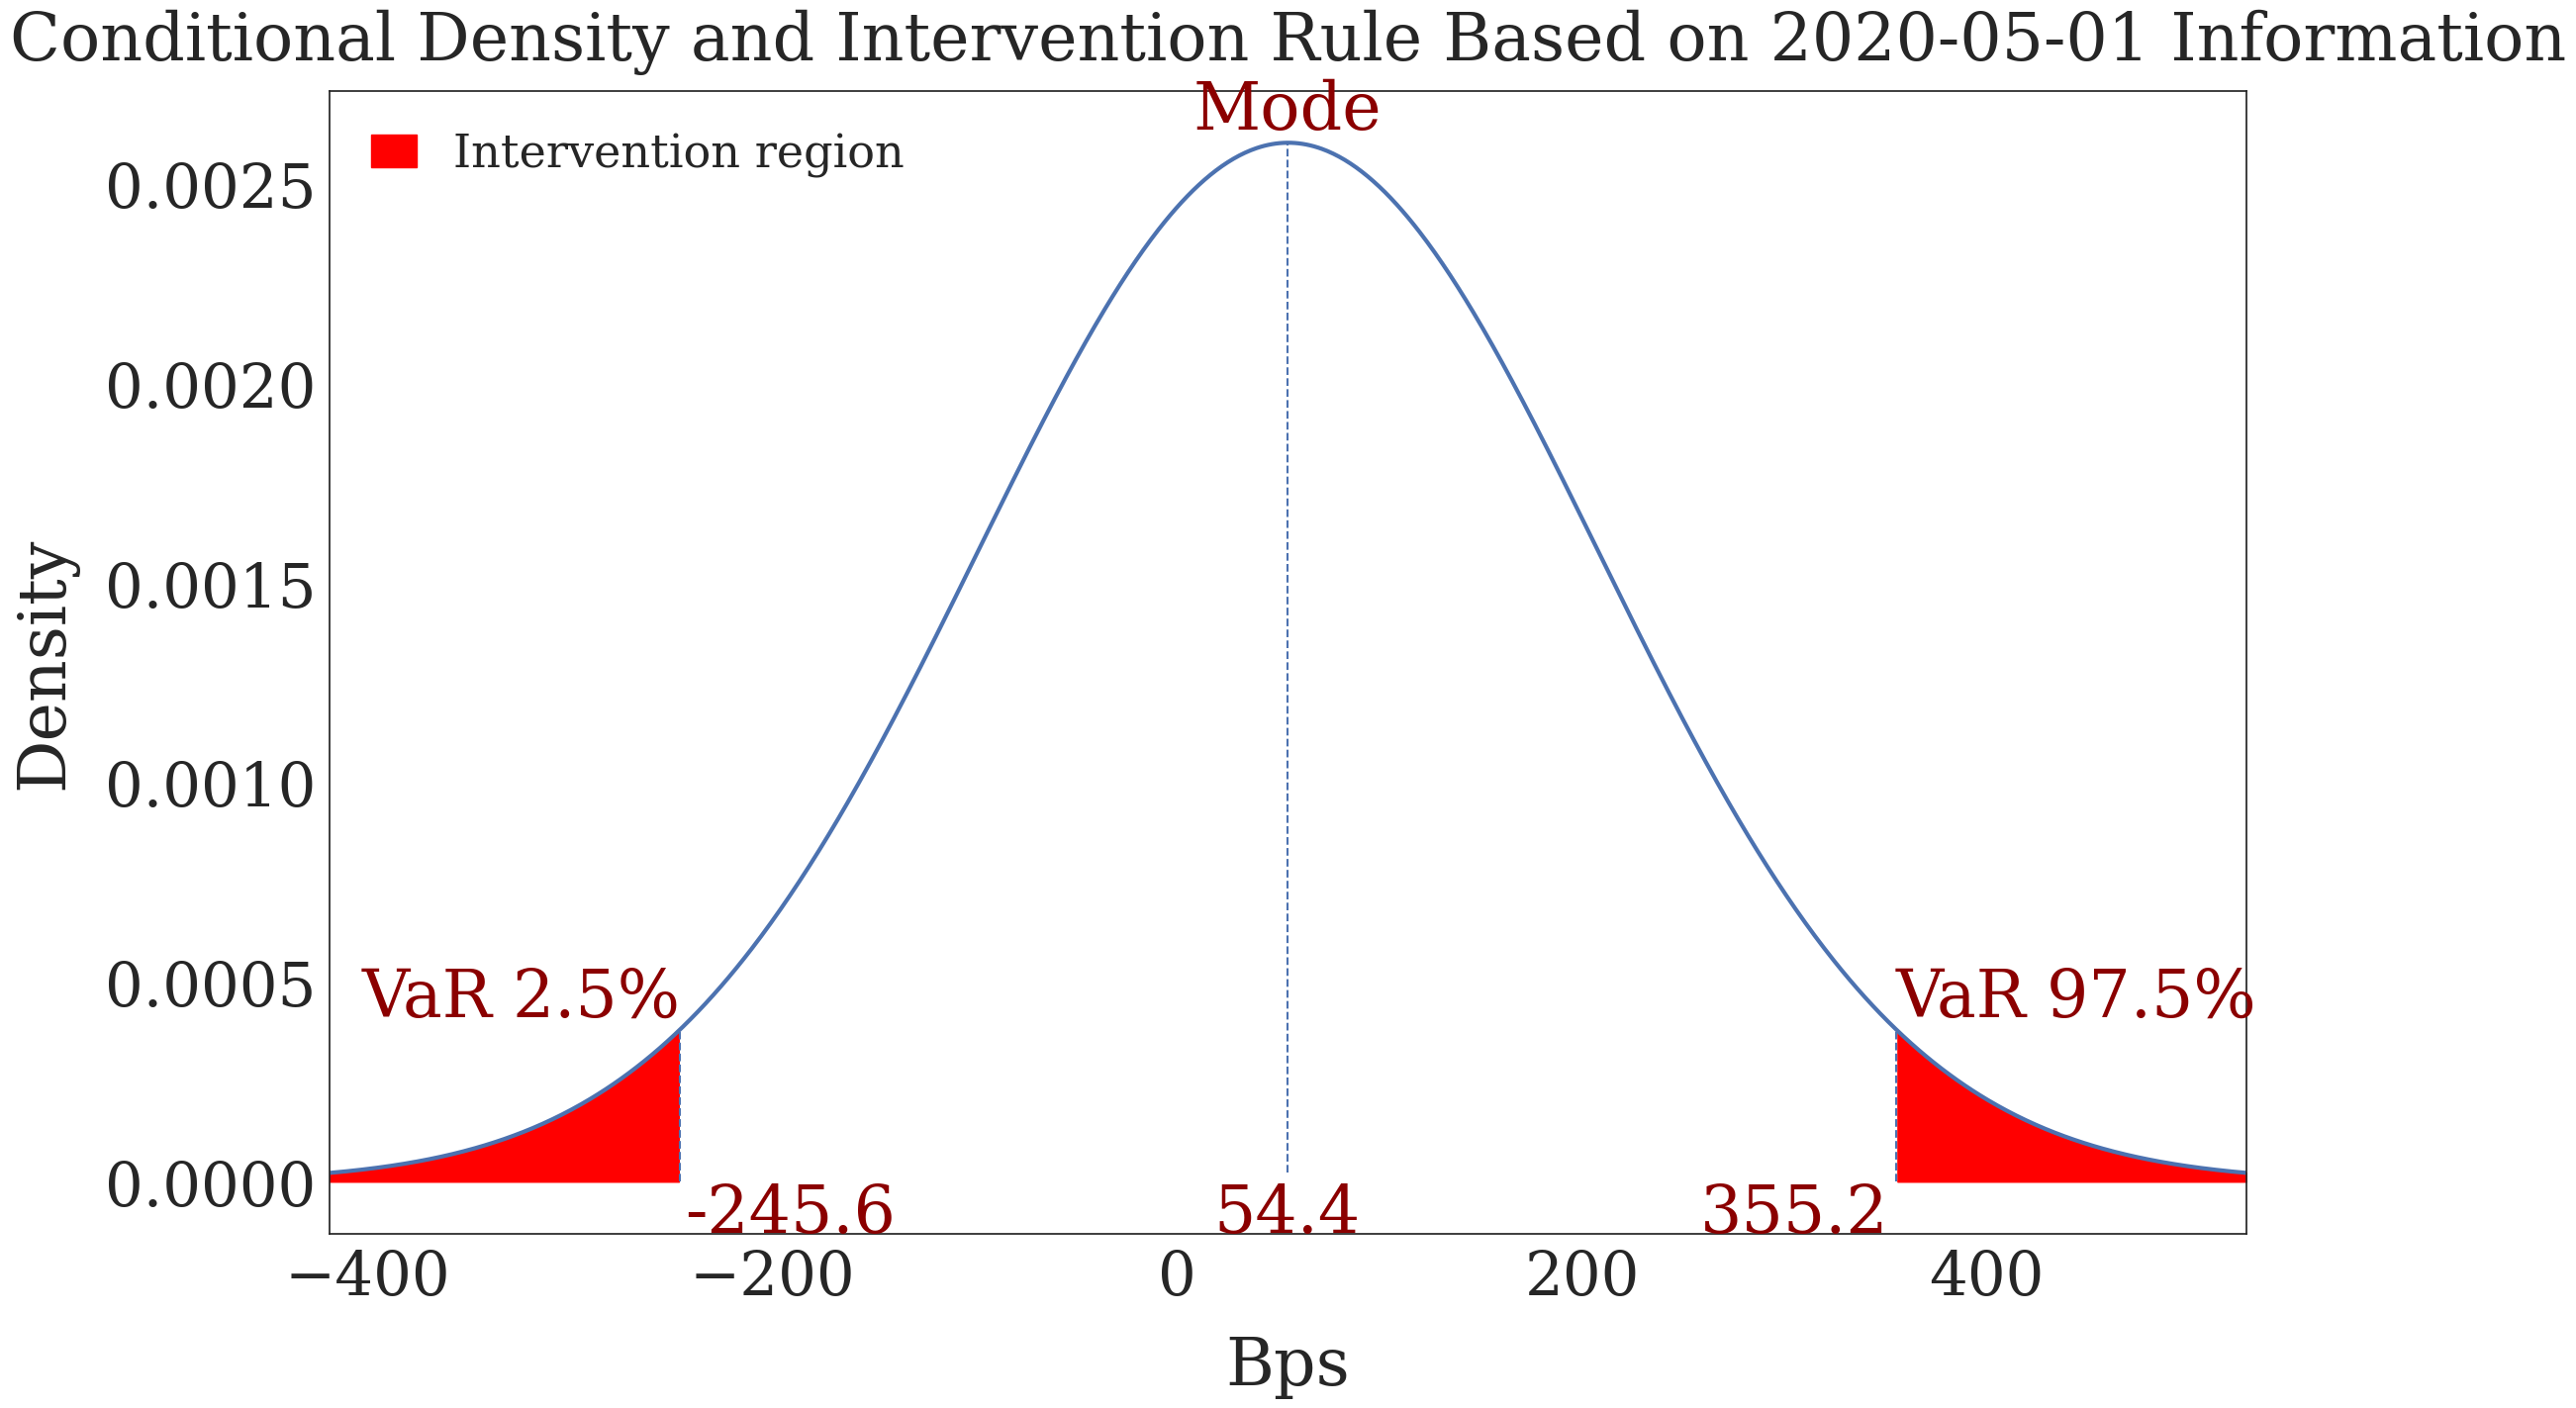
Figure 8. Conditional CDF, Out-of-sample#
# Plot
dgfor.plot.plot_conditional_cdf(q_low=0.025, q_high=0.975, size=300, title='', ylabel='Quantiles')

# Save the figure
cond_cdf_f = os.path.join(output_folder, 'conditional_cdf.pdf')
plt.savefig(cond_cdf_f, bbox_inches='tight')
plt.show()
plt.close('all')
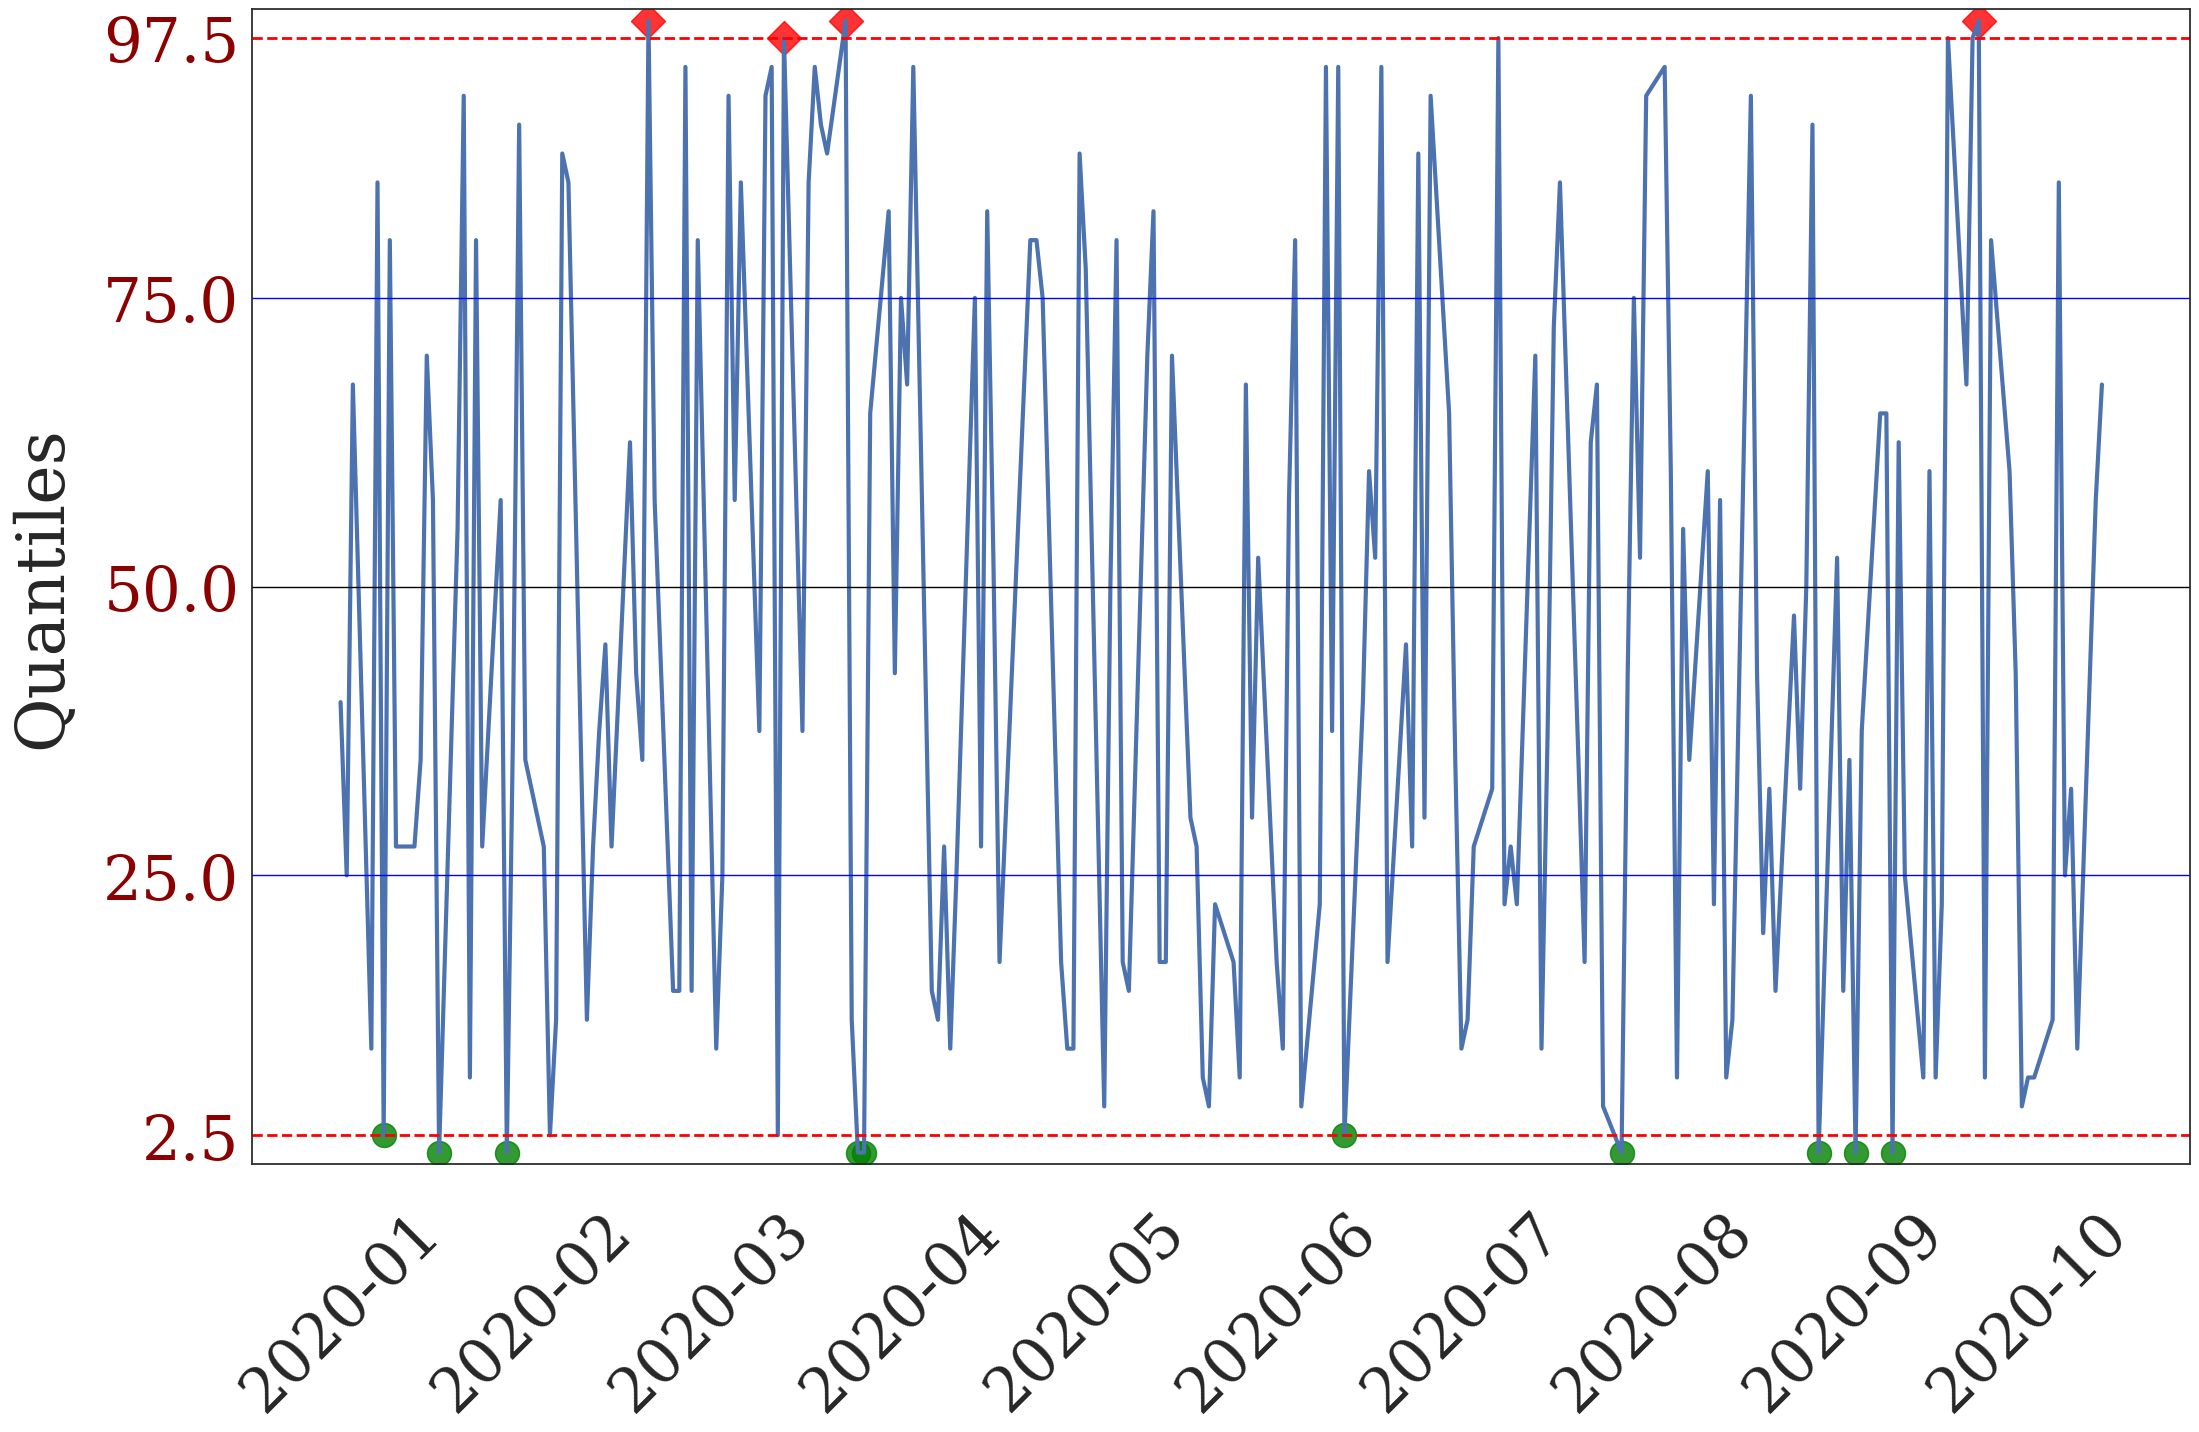
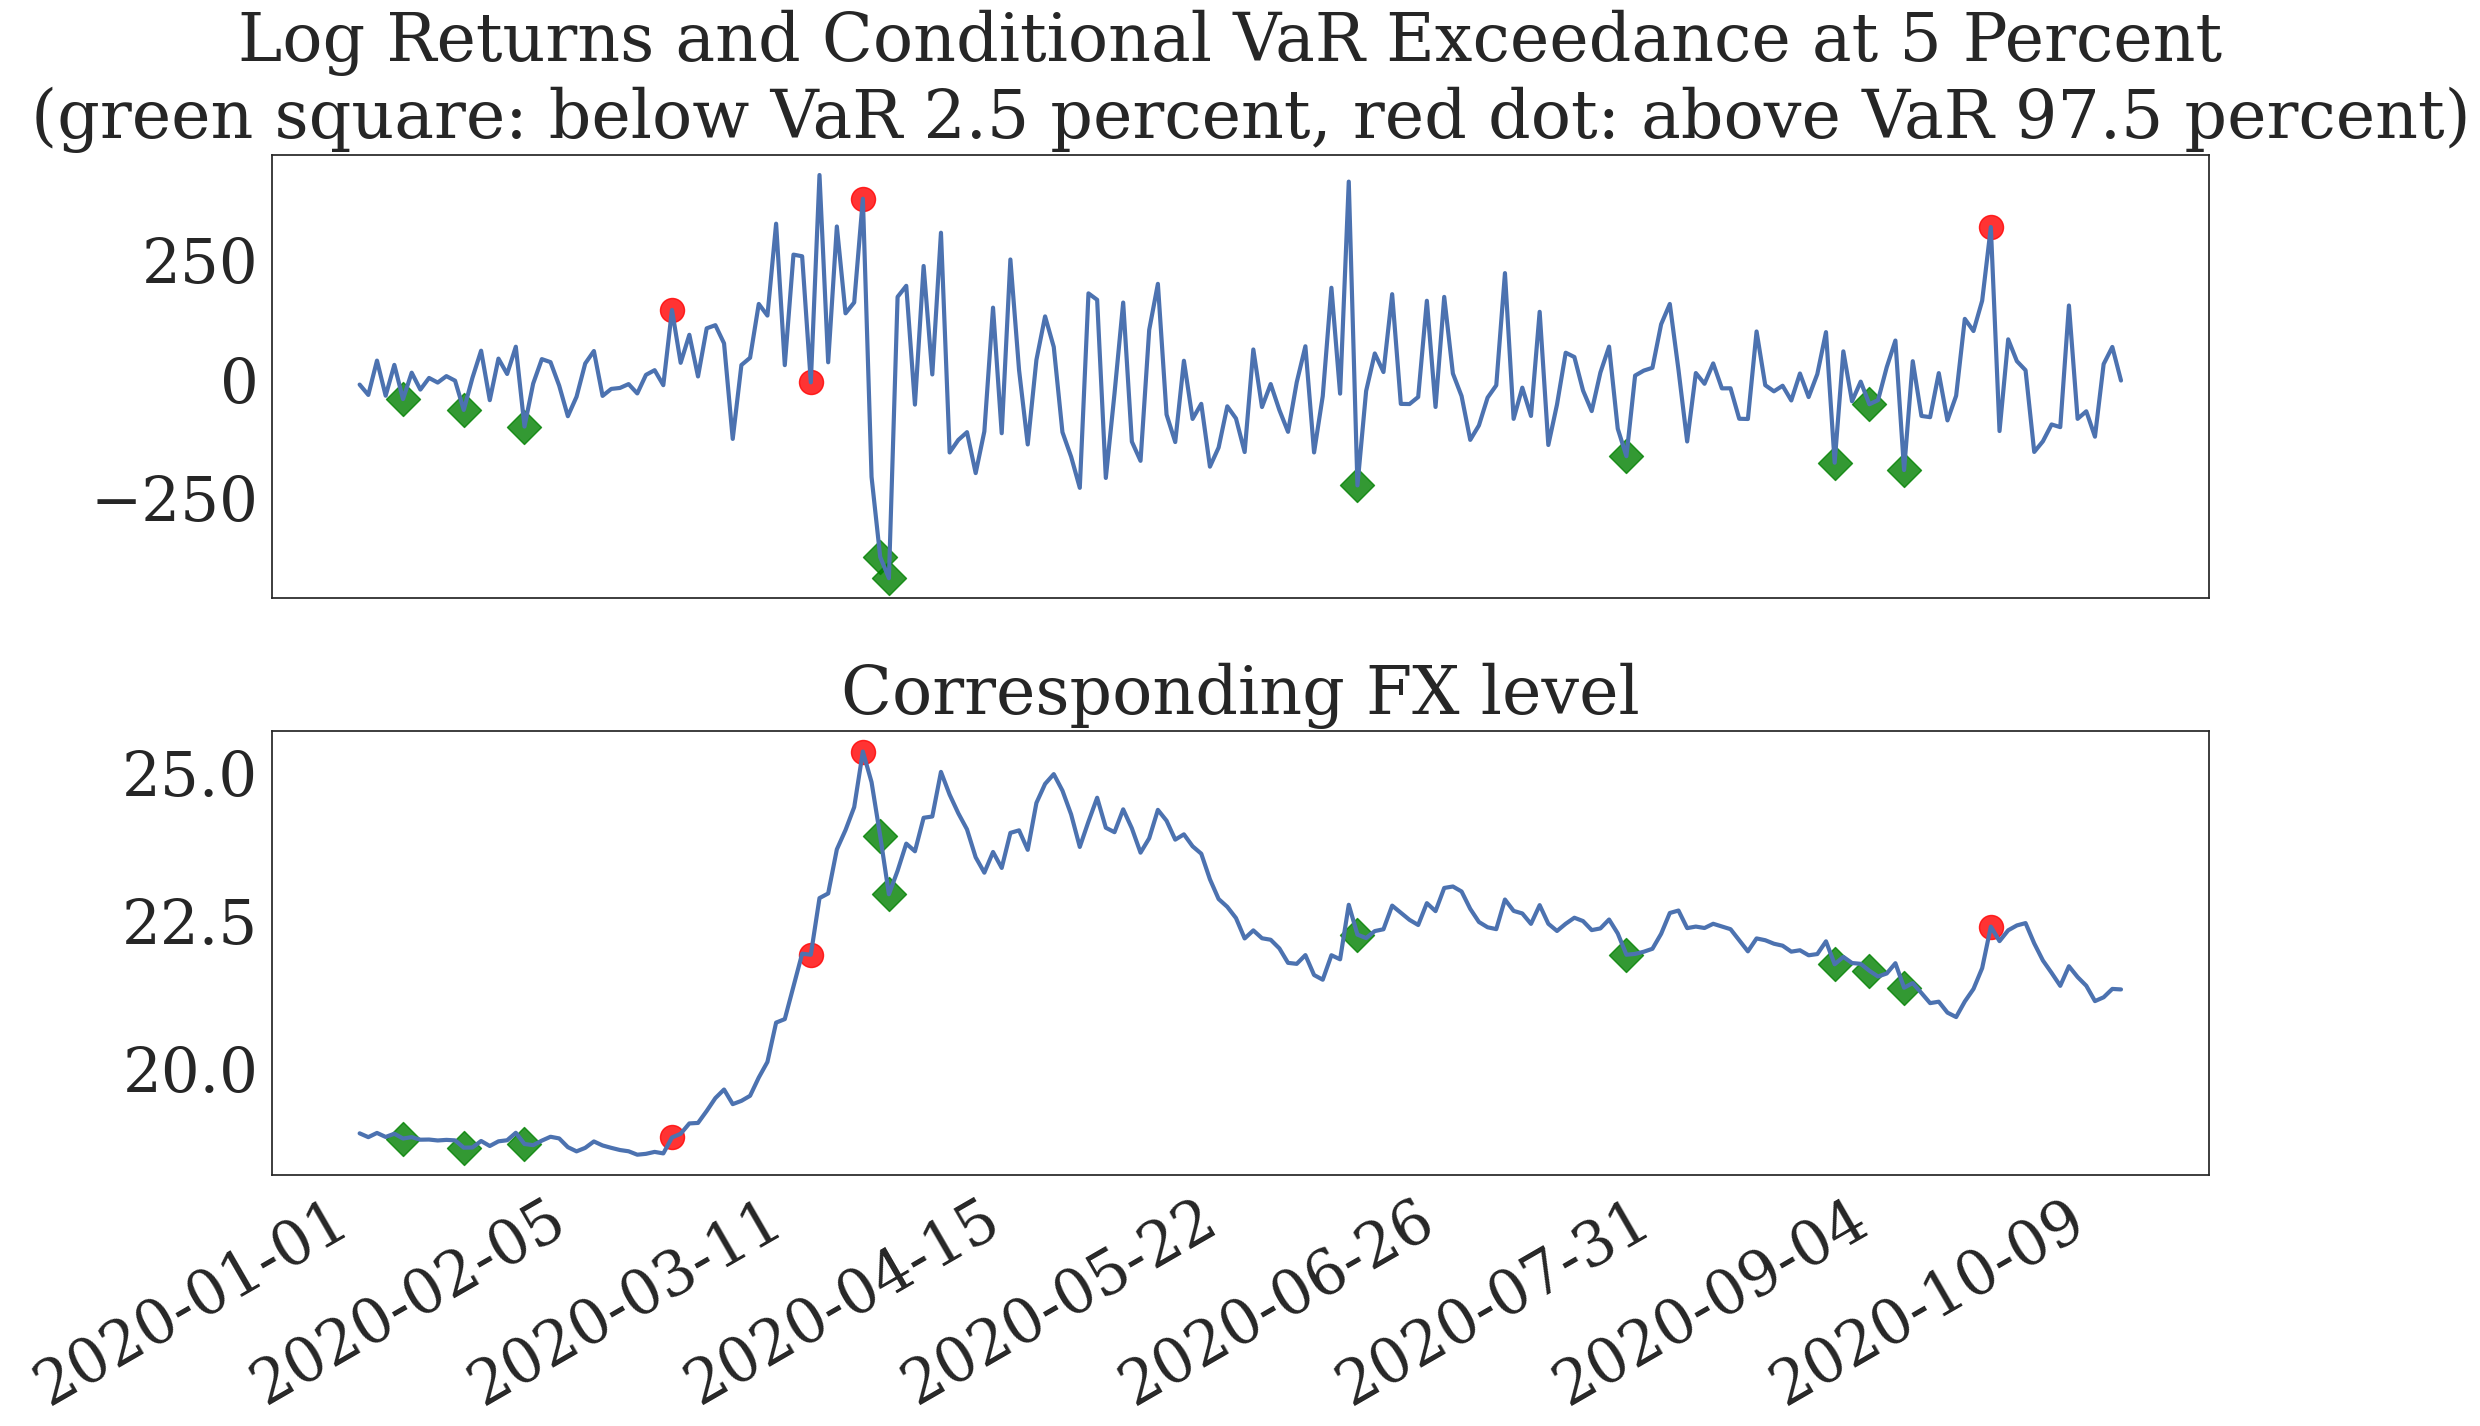
Figure 9. Conditional VaR Exceedance, Out-of-Sample#
# Plot
dgfor.plot.plot_var_exceedance(qv_l=[0.025, 0.975],
                          title_1= ('Log Returns and Conditional VaR Exceedance at 5 Percent'
                        ' \n (green square: below VaR 2.5 percent, red dot: above VaR 97.5 percent)'),
                          title_2='Corresponding FX level',
                          swap_color=True, size=300)

# Save the figure
cond_exc_f = os.path.join(output_folder, 'conditional_exceedance.pdf')
plt.savefig(cond_exc_f, bbox_inches='tight')
plt.show()
plt.close('all')
Benchmarking exercise#
# Forecast over the Banco Mexico intervention period for benchmarking
intervention_dates_l = df.loc[df['FX intervention dummy']==1, :].index
dgmfor = dgf.forecast(np.min(intervention_dates_l) - relativedelta(days=1), horizon=1)
dgmfor.compute_pit()

# Include the forecasted results within the original dataframe
dfxi = df.merge(dgmfor.dfor, left_index=True, right_index=True, how='outer')

# New variables
dfxi['FXI'] = (dfxi['sell_amount'] >0)
cond_fxi = (dfxi['FXI']==True)

dfxi['FXI current rate'] = np.nan
dfxi.loc[cond_fxi, 'FXI current rate'] = dfxi.loc[cond_fxi, 'FX level'].copy()

dfxi['FXI current logret'] = np.nan
dfxi.loc[cond_fxi,'FXI current logret'] = dfxi.loc[cond_fxi, 'FX log returns']

dfxi['FXI cdf'] = np.nan
dfxi.loc[cond_fxi, 'FXI cdf'] = dfxi.loc[cond_fxi, 'pit']

# Differentiate between intervention types
dmfxi = dfxi.loc[np.min(intervention_dates_l):np.max(intervention_dates_l), :].copy()
dfr = dmfxi.loc[dmfxi["type"]=='min price', :].copy() # Rule
dfd = dmfxi.loc[dmfxi["type"]=='no min price', :].copy() # Discretion
Figure 10. Rule-based FX Interventions on the Mexican Peso/USD#
# With minimum price (== rule based)
# Plot
fig, (ax1, ax2) = plt.subplots(2,1)

# Log returns
ax1.plot(dmfxi.index, dmfxi['FX log returns'], color='#004C97')
ax1.scatter(dfr.index, dfr['FXI current logret'], s=100, color='green', marker='D')

ax1.set_title('',y=1.02)
ax1.set_xlabel('')
ax1.set_ylabel('Log returns', labelpad=10)

# Level
ax2.plot(dmfxi.index, dmfxi['FX level'], color='#004C97')
ax2.scatter(dfr.index, dfr['FXI current rate'], s=100, color='green', marker='D')

ax2.set_title('FX interventions and FX level (sell USD)',
              y=1.02)
ax2.set_xlabel('')
ax2.set_ylabel('FX level', labelpad=10)

plt.subplots_adjust(left=None, bottom=None, right=None, top=None, wspace=None, hspace=0.5)

# Save the figure
bench_minprice_f = os.path.join(output_folder, 'benchmark_minprice.pdf')
plt.savefig(bench_minprice_f, bbox_inches='tight')
plt.show()
plt.close('all')
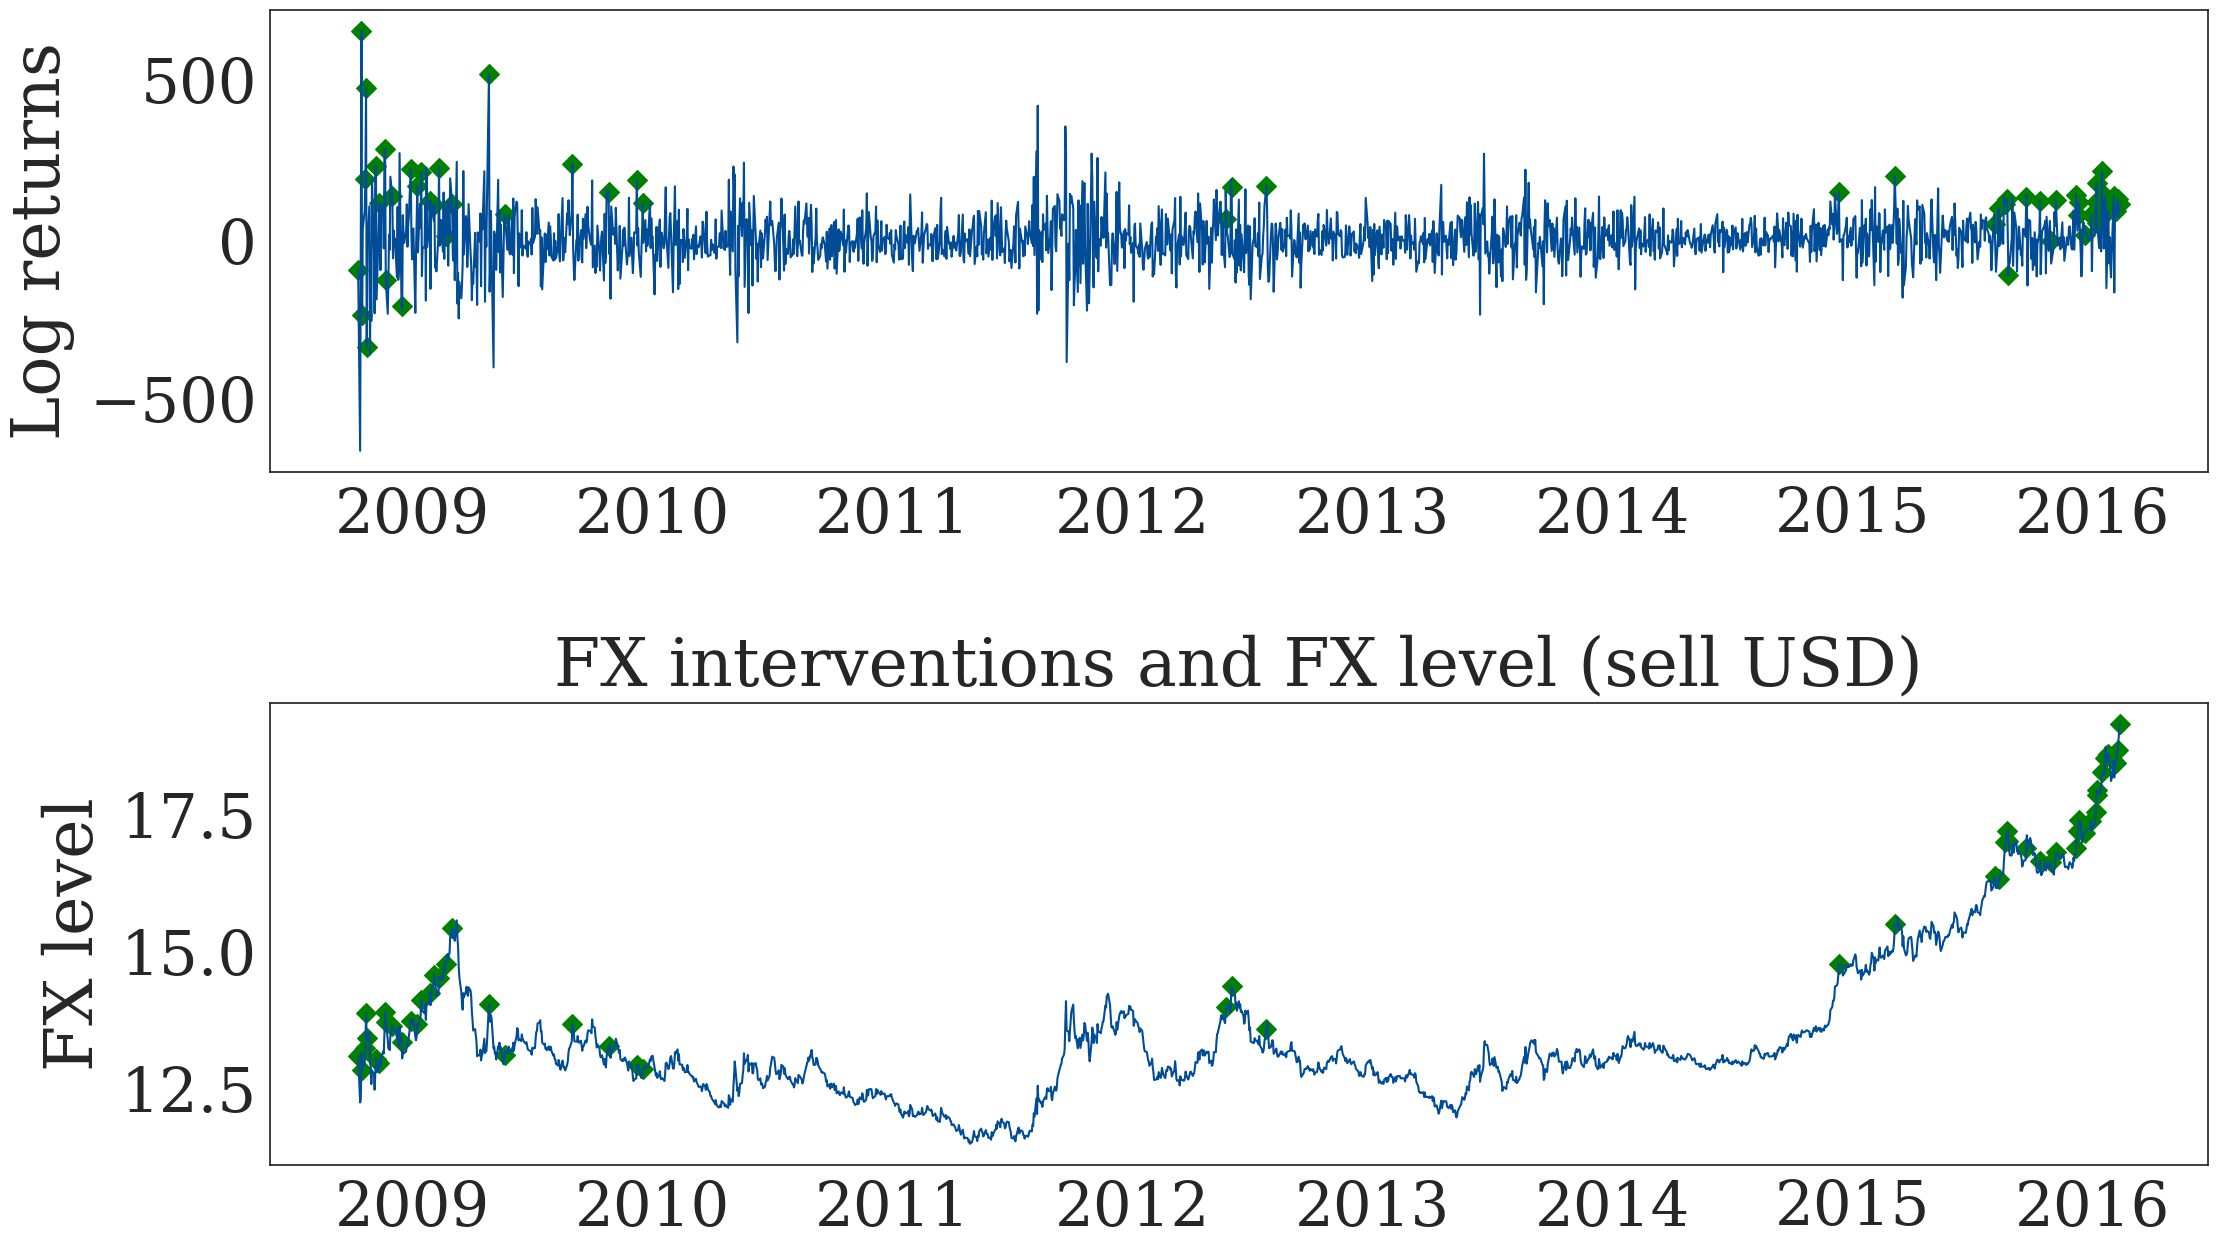
Figure 11. Conditional CDF and Rule-based FX Interventions#
# PLot
fig, ax1 = plt.subplots(1,1)

# Local merge to have the same axis
dr = pd.merge(dmfxi['pit'], dfr['FXI cdf'], left_index=True, right_index=True, how='left')

# Level plot
ax1.plot(dr.index, 100*dr['pit'], lw=1)
ax1.scatter(dr.index, 100*dr['FXI cdf'], alpha=1, c='green', marker='D', s=300)
ax1.set_title('',
              y=1.02)
ax1.set_xlabel('')
ax1.set_ylabel('Percentiles', labelpad=10)

ax1.axhline(y=5, color='red', linestyle='--', lw=2)
ax1.axhline(y=95, color='red', linestyle='--', lw=2)
ax1.axhline(y=50, color='black', linestyle='-', lw=1)

# Add the ticks, if needed
ax1.set_yticks([]) # Remove the standard y ticks
new_t_l = [5, 95]
new_ticks_l = sorted(list(ax1.get_yticks()) + new_t_l)
extra_idx_l = [new_ticks_l.index(x) for x in new_t_l]
ax1.set_yticks(new_ticks_l) # Add new ticks

ax1.set_ylim(-5, 105)

# Save the figure
bench_minprice_cdf_f = os.path.join(output_folder, 'benchmark_minprice_cdf.pdf')
plt.savefig(bench_minprice_cdf_f, bbox_inches='tight')
plt.show()
plt.close('all')
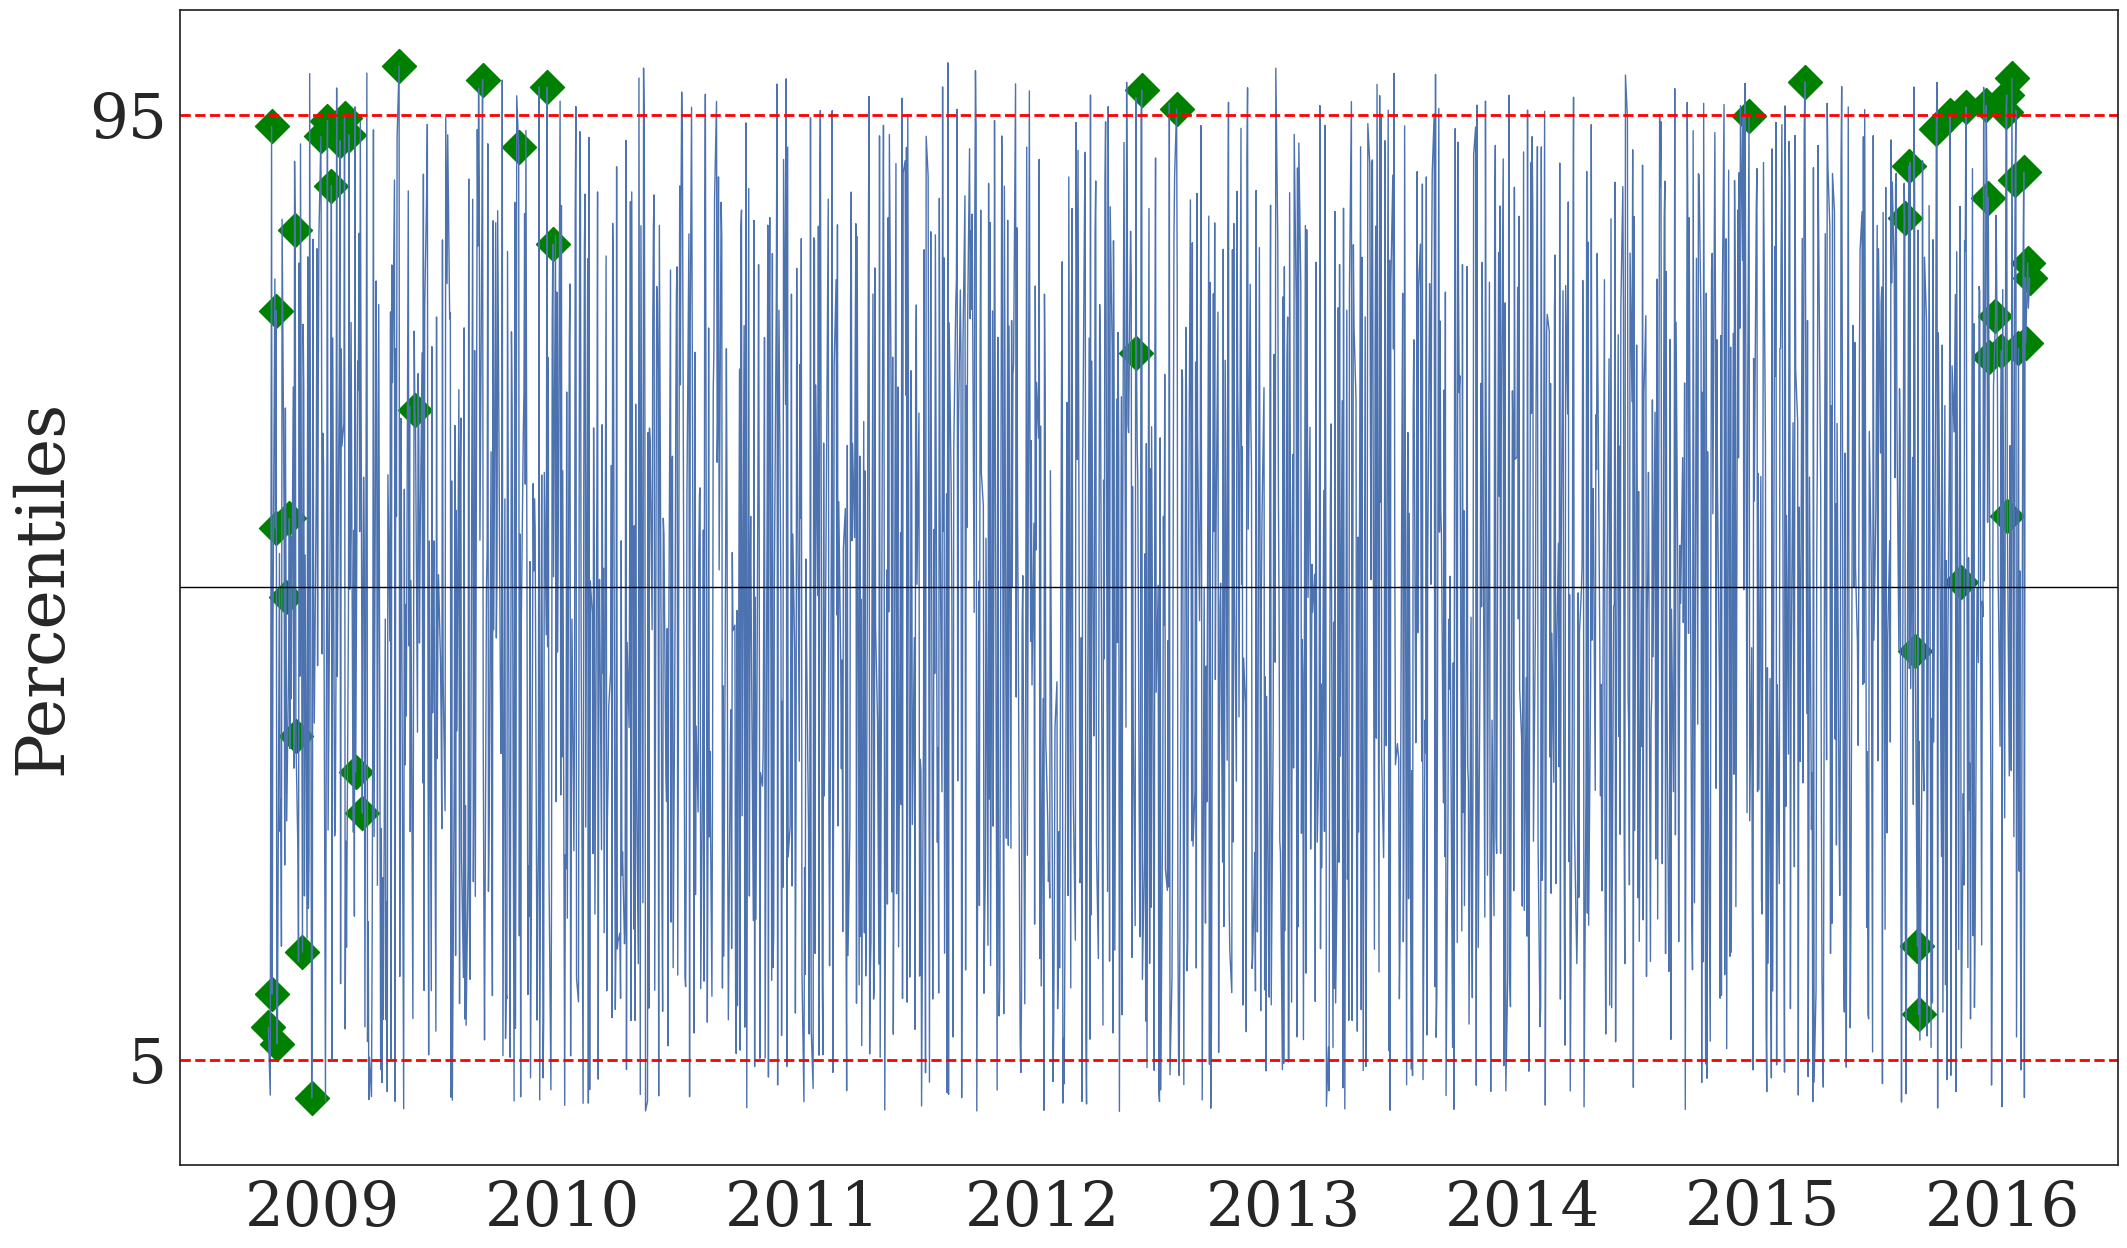
Figure 12. Discretionary FX Interventions on the Mexican Peso/USD#
# Plot
fig, (ax1, ax2) = plt.subplots(2,1)

# Log returns
ax1.plot(dmfxi.index, dmfxi['FX log returns'], color='#004C97')
ax1.scatter(dfd.index, dfd['FXI current logret'],
            s=100, color='red',
            marker='D')

ax1.set_title('',
              y=1.02)
ax1.set_xlabel('')
ax1.set_ylabel('Log returns', labelpad=10)

# Level
ax2.plot(dmfxi.index, dmfxi['FX level'], color='#004C97')
ax2.scatter(dfd.index, dfd['FXI current rate'], s=100, color='red',
            marker='D')

ax2.set_title('FX interventions and FX level (sell USD)',
              y=1.02)
ax2.set_xlabel('')
ax2.set_ylabel('FX level', labelpad=10)

plt.subplots_adjust(left=None, bottom=None, right=None, top=None, wspace=None, hspace=0.5)

# Save the figure
bench_nominprice_f = os.path.join(output_folder, 'benchmark_no_minprice.pdf')
plt.savefig(bench_nominprice_f, bbox_inches='tight')
plt.show()
plt.close('all')
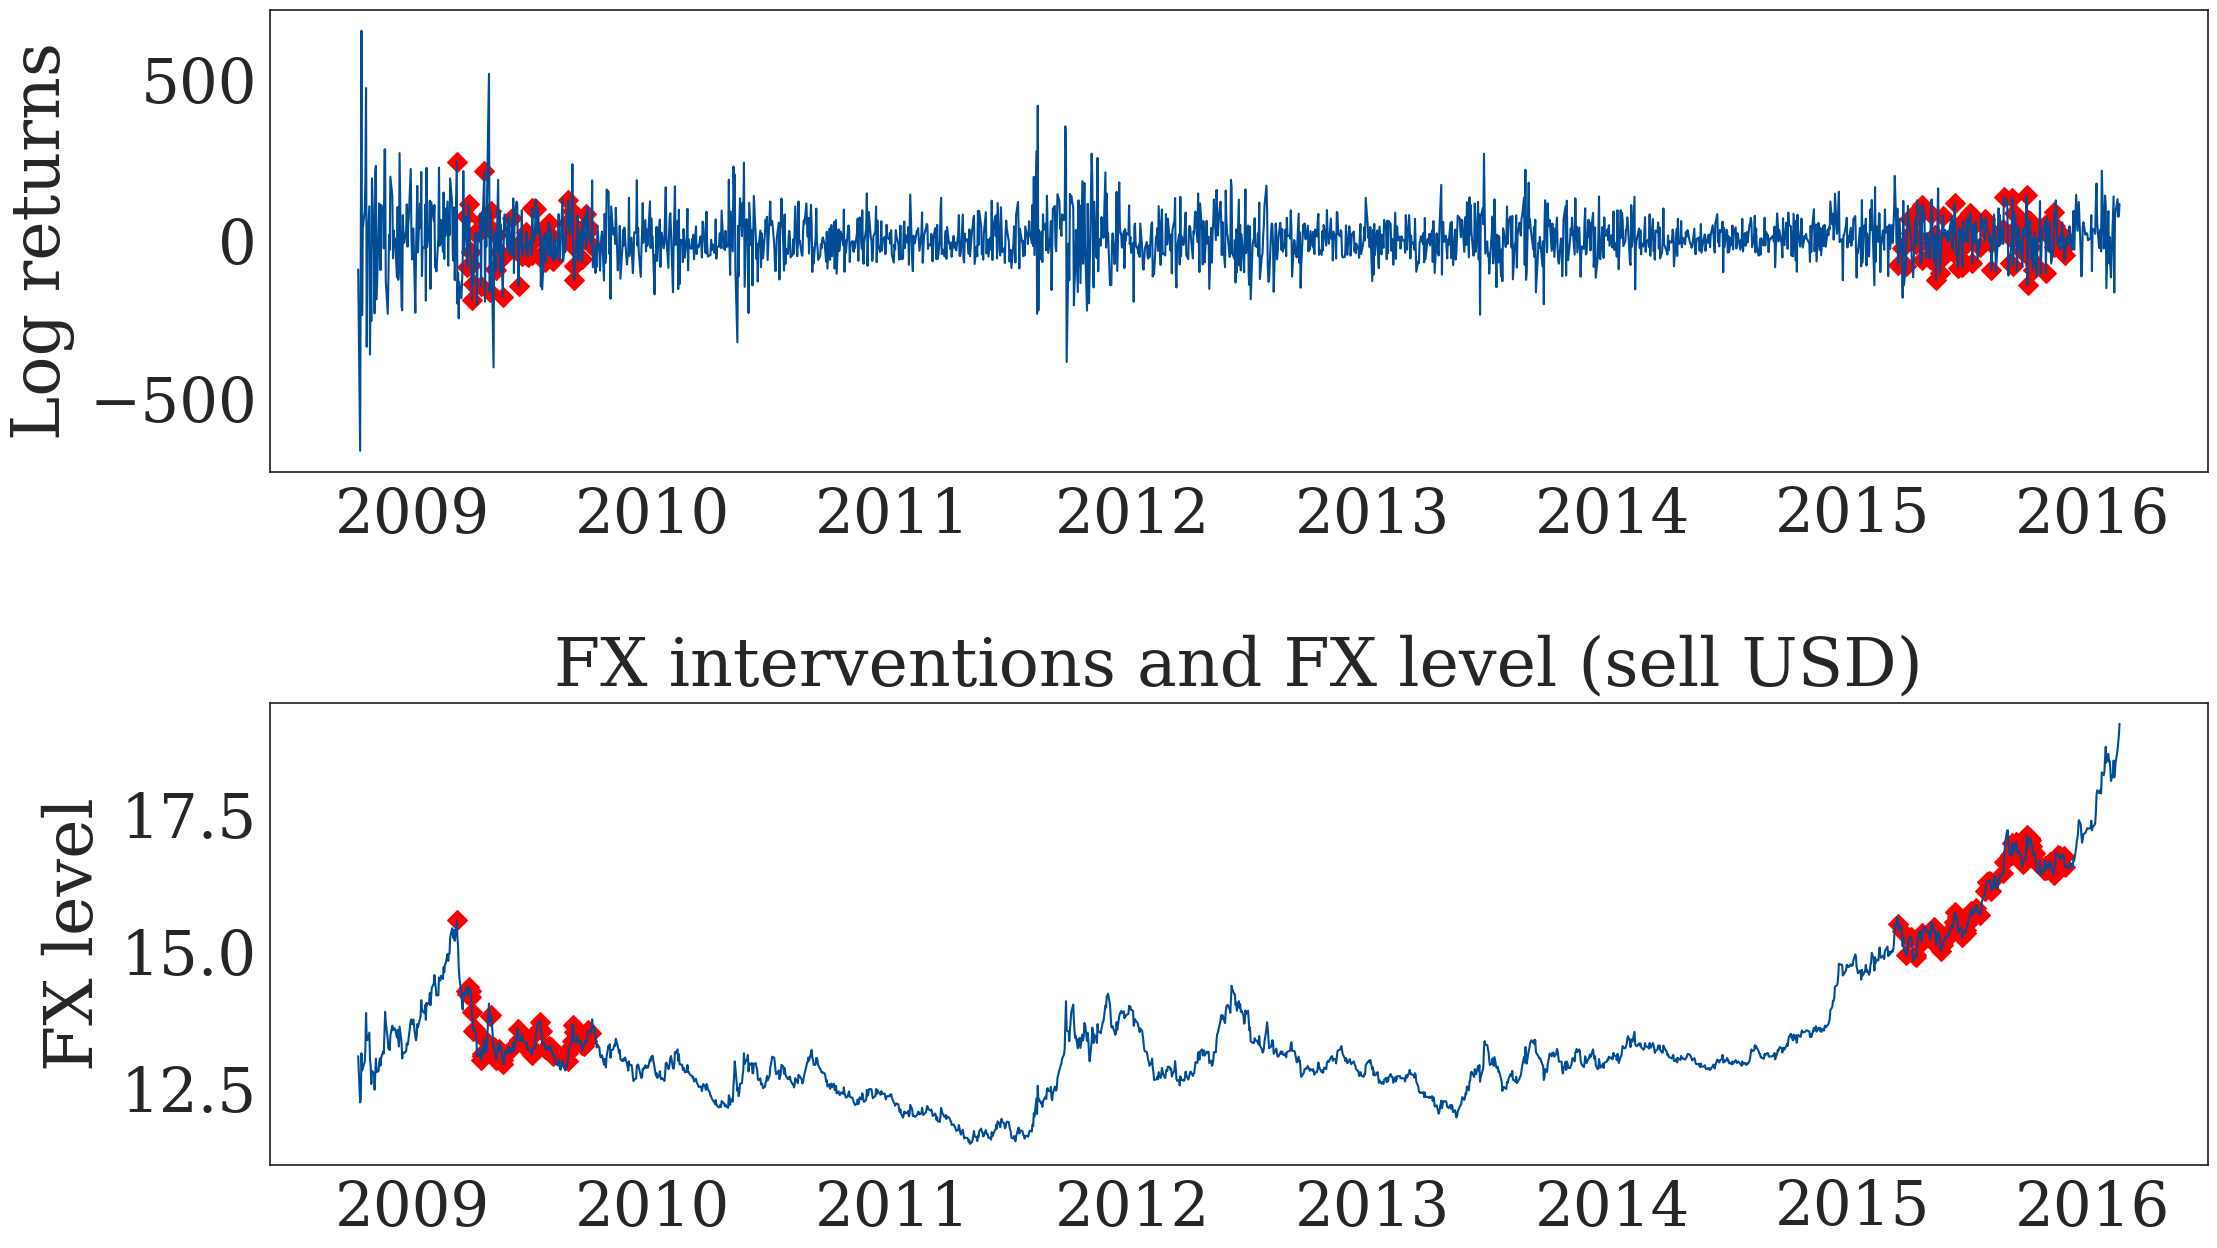
Figure 13. Conditional CDF and Discretionary FX Interventions#
# Local merge to have the same axis
dd = pd.merge(dmfxi['pit'], dfd['FXI cdf'],
              left_index=True, right_index=True, how='left')

fig, ax1 = plt.subplots(1,1)
# Level plot
ax1.plot(dd.index, 100*dd['pit'], lw=1)
ax1.scatter(dd.index, 100*dd['FXI cdf'], alpha=0.8, c='red', marker='o', s=200)
ax1.set_title('', y=1.02)
ax1.set_xlabel('')
ax1.set_ylabel('Percentiles', labelpad=10)

ax1.axhline(y=5, color='red', linestyle='--', lw=2)
ax1.axhline(y=95, color='red', linestyle='--', lw=2)
ax1.axhline(y=50, color='black', linestyle='-', lw=1)

# Add the ticks, if needed
ax1.set_yticks([]) # Remove the standard y ticks
new_t_l = [5, 95]
new_ticks_l = sorted(list(ax1.get_yticks()) + new_t_l)
extra_idx_l = [new_ticks_l.index(x) for x in new_t_l]
ax1.set_yticks(new_ticks_l) # Add new ticks

ax1.set_ylim(-5, 105)

# Save the figure
bench_no_minprice_cdf_f = os.path.join(output_folder, 'benchmark_no_minprice_cdf.pdf')
plt.savefig(bench_no_minprice_cdf_f, bbox_inches='tight')
plt.show()
plt.close('all')
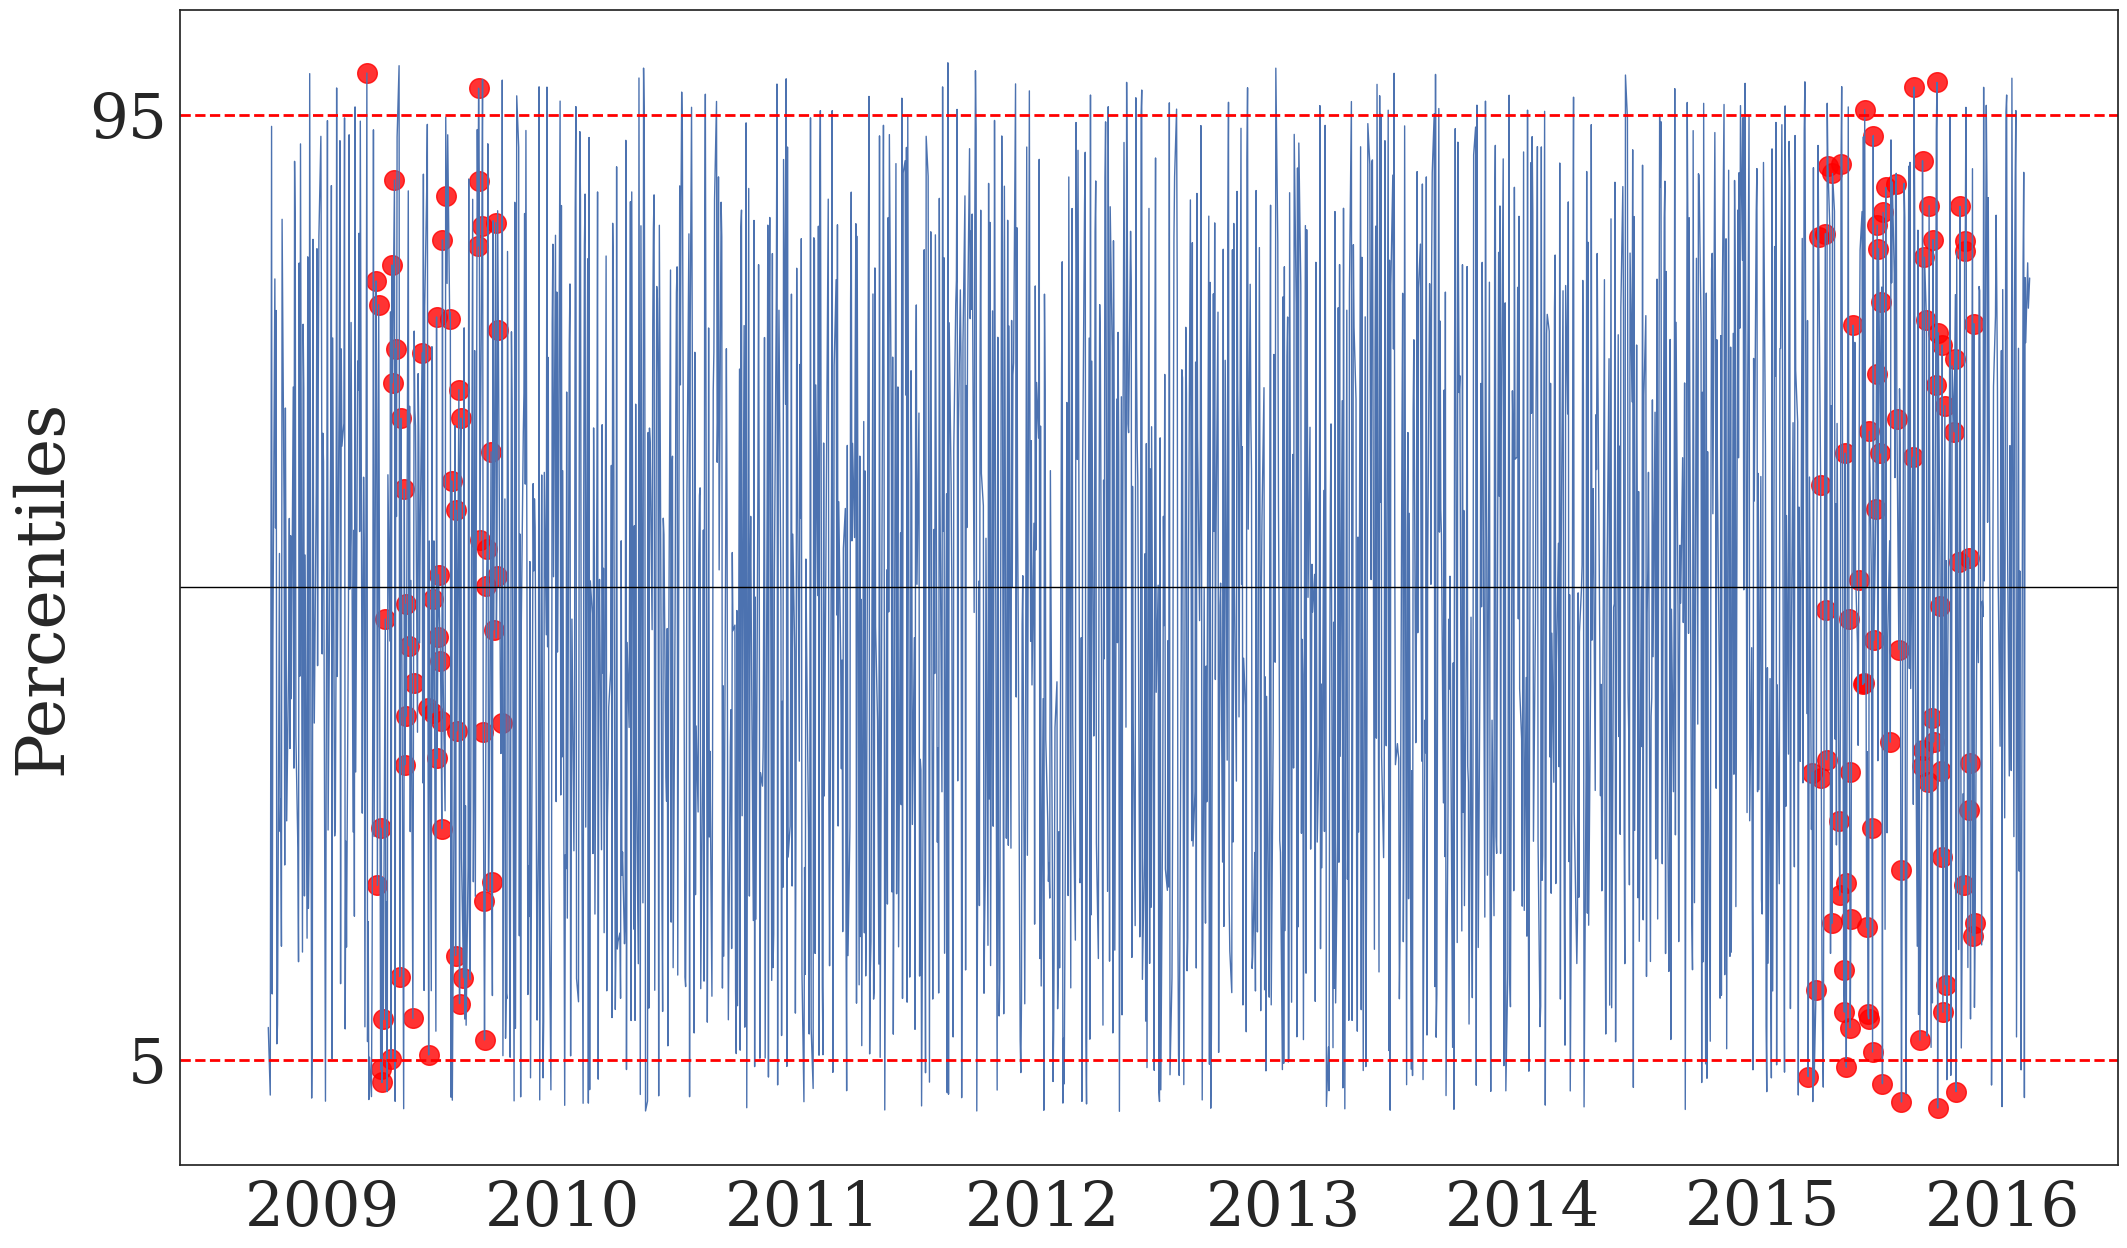
Optimize Model#
dgo = dg.optimize()
mean_optim = dgo.optimize_mean()
Optimizing the Mean model. step 1: exog_l
100%|██████████| 255/255 [00:21<00:00, 11.97it/s]
Best Out-Of-Sample combination of exogenous variables:
Bid ask abs,Forward points first difference,EURUSD log returns,VIX first diff,Oil prices log returns,FX intervention dummy lag
Optimizing the Mean model. step 2: number of lags
100%|██████████| 10/10 [00:00<00:00, 11.14it/s]
Best Out-Of-Sample number of lags: 0
vol_dist_optimization = dgo.optimize_vol_distrib()
vol_dist_optimization
100%|██████████| 28/28 [03:17<00:00, 7.04s/it]
Best Out-Of-Sample Volatility Model: RiskMetric
Best Out-Of-Sample Distribution Family: SkewStudent
| KS_normalized_innovations | KS_normalized_innovations_pvalues | KS_PIT_test | KS_PIT_test_pvalues | Rossi_Shekopysan_PIT_test_tails | ... | Rossi_Shekopysan_PIT_test_right_tail | log_score | tails_log_score | left_tail_log_score | right_tail_log_score | ||
|---|---|---|---|---|---|---|---|---|---|---|---|---|
| volatility_model | distribution | |||||||||||
| Constant | Normal | False | 0.0 | False | 0.0 | False | ... | False | -5.04257 | -1.566547 | -1.08566 | -1.086617 |
| ARCH | Normal | False | 0.0 | False | 0.0 | False | ... | False | -5.009953 | -1.459077 | -1.099263 | -1.035228 |
| RiskMetric | Normal | False | 0.000547 | False | 0.000547 | False | ... | False | -4.986837 | -1.467944 | -1.080434 | -1.054001 |
| GARCH | Normal | False | 0.000742 | False | 0.000742 | False | ... | False | -4.980809 | -1.470709 | -1.090697 | -1.048915 |
| GJR-GARCH | Normal | False | 0.005783 | False | 0.005783 | False | ... | False | -4.974227 | -1.4876 | -1.120022 | -1.045556 |
| EGARCH | Normal | False | 0.000092 | False | 0.000092 | False | ... | False | -4.97205 | -1.485041 | -1.122117 | -1.034156 |
| EWMA | Normal | False | 0.024125 | False | 0.024125 | False | ... | False | -4.95291 | -1.506733 | -1.110205 | -1.078375 |
| RiskMetric | StudentT | False | 0.010851 | False | 0.010851 | False | ... | False | -4.879082 | -1.604971 | -1.190337 | -1.133393 |
| GJR-GARCH | SkewStudent | False | 0.039789 | False | 0.039789 | False | ... | False | -4.875905 | -1.62644 | -1.191692 | -1.161776 |
| EGARCH | SkewStudent | False | 0.026603 | False | 0.026603 | False | ... | False | -4.873035 | -1.629643 | -1.199987 | -1.155391 |
| GARCH | StudentT | False | 0.012535 | False | 0.012535 | False | ... | False | -4.867998 | -1.621192 | -1.208556 | -1.137135 |
| GJR-GARCH | StudentT | False | 0.011123 | False | 0.011123 | False | ... | False | -4.863588 | -1.63355 | -1.229413 | -1.135201 |
| EGARCH | StudentT | False | 0.008192 | False | 0.008192 | False | ... | False | -4.861173 | -1.631491 | -1.229093 | -1.128699 |
| EWMA | StudentT | False | 0.004003 | False | 0.004003 | False | ... | False | -4.856825 | -1.639105 | -1.215933 | -1.155787 |
| RiskMetric | GeneralizedError | False | 0.000802 | False | 0.000802 | False | ... | False | -4.804087 | -1.632333 | -1.214081 | -1.14706 |
| ARCH | SkewStudent | False | 0.0 | False | 0.0 | False | ... | False | -4.801348 | -1.741063 | -1.264074 | -1.26724 |
| GARCH | GeneralizedError | False | 0.002497 | False | 0.002497 | False | ... | False | -4.796392 | -1.640416 | -1.22777 | -1.145731 |
| ARCH | StudentT | False | 0.0 | False | 0.0 | False | ... | False | -4.793713 | -1.743412 | -1.307338 | -1.226357 |
| GJR-GARCH | GeneralizedError | False | 0.002383 | False | 0.002383 | False | ... | False | -4.793194 | -1.652802 | -1.245893 | -1.146811 |
| EGARCH | GeneralizedError | False | 0.000739 | False | 0.000739 | False | ... | False | -4.791681 | -1.649599 | -1.24606 | -1.138265 |
| EWMA | GeneralizedError | False | 0.000058 | False | 0.000058 | False | ... | False | -4.773021 | -1.670509 | -1.243921 | -1.172531 |
| Constant | StudentT | False | 0.02714 | False | 0.02714 | False | ... | False | -4.76081 | -1.840813 | -1.32814 | -1.263373 |
| ARCH | GeneralizedError | False | 0.0 | False | 0.0 | False | ... | False | -4.651161 | -1.798946 | -1.345029 | -1.263181 |
| Constant | GeneralizedError | False | 0.00069 | False | 0.00069 | False | ... | False | -4.58129 | -1.877664 | -1.350475 | -1.290213 |
| RiskMetric | SkewStudent | True | 0.175627 | True | 0.175627 | True | ... | False | -4.891099 | -1.596891 | -1.15392 | -1.15908 |
| GARCH | SkewStudent | True | 0.207382 | True | 0.207382 | True | ... | False | -4.880204 | -1.611642 | -1.170178 | -1.162337 |
| EWMA | SkewStudent | True | 0.154791 | True | 0.154791 | True | ... | False | -4.867917 | -1.629429 | -1.177134 | -1.180854 |
| Constant | SkewStudent | True | 0.954117 | True | 0.954117 | True | ... | True | -4.764402 | -1.837485 | -1.306421 | -1.27976 |
28 rows × 11 columns
params_finetuning = dgo.fine_tune_model()
params_finetuning
Fine Tune the best model
exog_l = ['Bid ask abs', 'Forward points first difference', 'EURUSD log returns', 'VIX first diff', 'Oil prices log returns', 'FX intervention dummy lag']
lags = 0
volatility model = RiskMetric
distribution family = SkewStudent
Stabilize Parameters with ZigZag method ...
Converged !
| iteration_0 | iteration_1 | iteration_2 | iteration_3 | |||||
|---|---|---|---|---|---|---|---|---|
| params | pvalues | params | pvalues | params | pvalues | params | pvalues | |
| Const | -1.216365 | 2.309328e-01 | -0.607584 | 4.481975e-01 | -0.608573 | 4.475783e-01 | -0.607069 | 4.486395e-01 |
| Bid ask abs | 179.577584 | 1.419435e-03 | 130.946085 | 2.341489e-03 | 133.040555 | 2.061630e-03 | 133.283738 | 2.026134e-03 |
| Forward points first difference | 29.503987 | 4.509421e-11 | 25.199999 | 2.574928e-24 | 24.954502 | 1.246611e-23 | 24.939480 | 1.451601e-23 |
| EURUSD log returns | -0.216986 | 6.049060e-35 | -0.160931 | 1.556255e-30 | -0.152832 | 6.030364e-28 | -0.151594 | 1.419340e-27 |
| VIX first diff | 16.435769 | 2.246135e-62 | 16.174239 | 2.540096e-133 | 16.057678 | 1.592706e-135 | 16.032580 | 5.843260e-136 |
| Oil prices log returns | -0.021753 | 9.899393e-06 | -0.022793 | 2.262161e-11 | -0.022642 | 2.016052e-11 | -0.022590 | 2.084256e-11 |
| FX intervention dummy lag | -7.435743 | 1.756491e-01 | 2.039140 | 6.738948e-01 | 1.754372 | 7.209052e-01 | 1.741334 | 7.228677e-01 |
| eta | 8.396661 | 8.149240e-27 | 8.324480 | 2.356683e-27 | 8.332597 | 2.653405e-27 | 8.334466 | 2.729595e-27 |
| lambda | 0.097658 | 1.369063e-07 | 0.101543 | 7.398261e-08 | 0.102415 | 5.931720e-08 | 0.102566 | 5.474931e-08 |
final_forecaster = dgo.final_model.forecast()
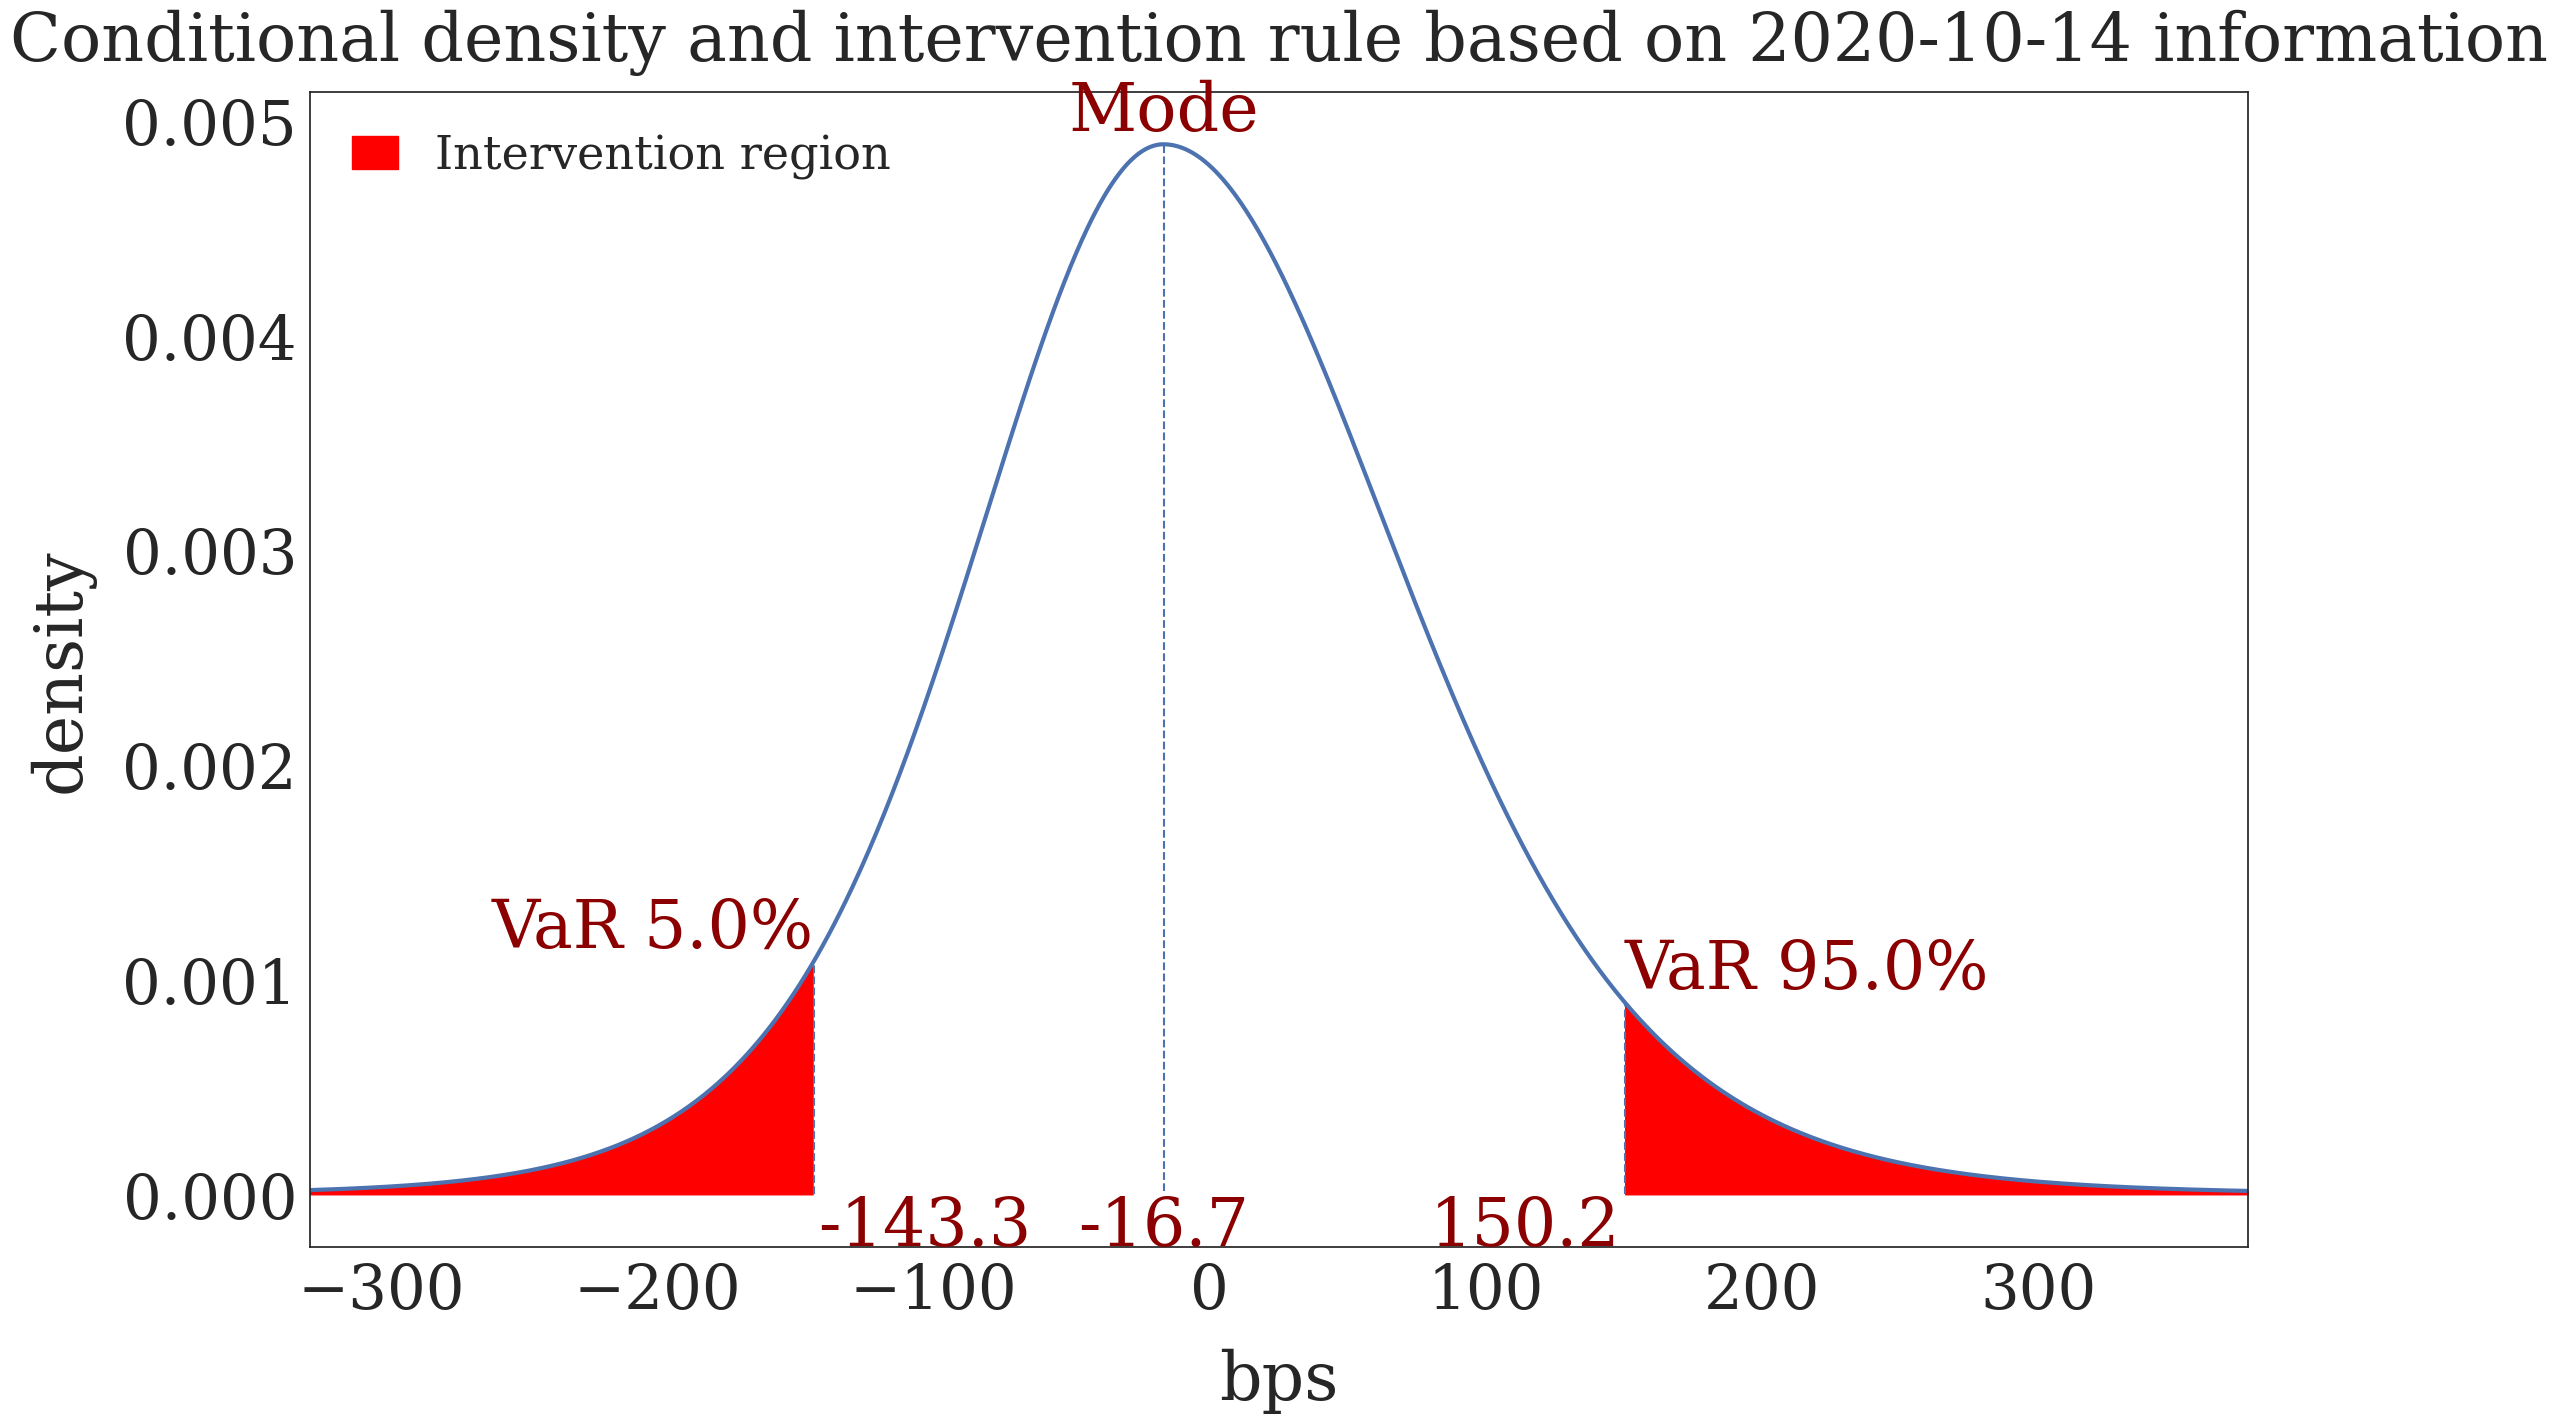
final_forecaster.plot.plot_pdf_rule()
Model is fixed and won't be fitted again. The parameter provided will be used
                           AR-X - RiskMetrics2006 Model Results
=========================================================================================
Dep. Variable:                    FX log returns   R-squared:                          --
Mean Model:                                 AR-X   Adj. R-squared:                     --
Vol Model:                       RiskMetrics2006   Log-Likelihood:               -30537.2
Distribution:      Standardized Skew Student's t   AIC:                           61092.4
Method:                User-specified Parameters   BIC:                           61152.2
                                                   No. Observations:                 5681
Date:                           Sat, Apr 15 2023
Time:                                   10:18:55
                Mean Model
==========================================
                                      coef
------------------------------------------
Const                              -0.6071
Bid ask abs                       133.2837
Forward points first difference    24.9395
EURUSD log returns                 -0.1516
VIX first diff                     16.0326
Oil prices log returns             -0.0226
FX intervention dummy lag           1.7413
     Distribution
=====================
                 coef
---------------------
eta            8.3345
lambda         0.1026
=====================

Results generated with user-specified parameters.
Std. errors not available when the model is not estimated,
<Axes: title={'center': 'Conditional density and intervention rule based on 2020-10-14 information'}, xlabel='bps', ylabel='density'>
