import matplotlib.pyplot as plt
import numpy as np
from statsmodels.tsa.stattools import adfuller
2: Augmented Dickey-Fuller Test#
def generate_ar_process(lags, coefs, length):

    #cast coefs to np array
    coefs = np.array(coefs)

    #initial values
    series = [np.random.normal() for _ in range(lags)]

    for _ in range(length):
        #get previous values of the series, reversed
        prev_vals = series[-lags:][::-1]

        #get new value of time series
        new_val = np.sum(np.array(prev_vals) * coefs) + np.random.normal()

        series.append(new_val)

    return np.array(series)
def perform_adf_test(series):
    result = adfuller(series)
    print('ADF Statistic: %f' % result[0])
    print('p-value: %f' % result[1])
AR(1) Process#
Stationary#
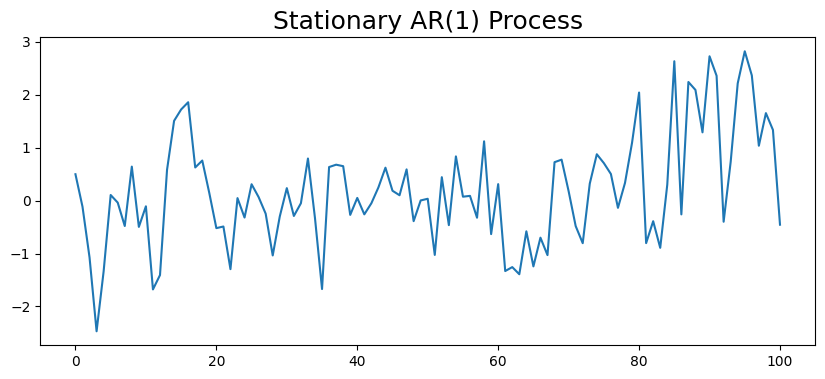
ar_1_process = generate_ar_process(1, [.5], 100)
plt.figure(figsize=(10,4))
plt.plot(ar_1_process)
plt.title('Stationary AR(1) Process', fontsize=18)
Text(0.5, 1.0, 'Stationary AR(1) Process')

perform_adf_test(ar_1_process)
ADF Statistic: -5.700818
p-value: 0.000001
Non-Stationary#
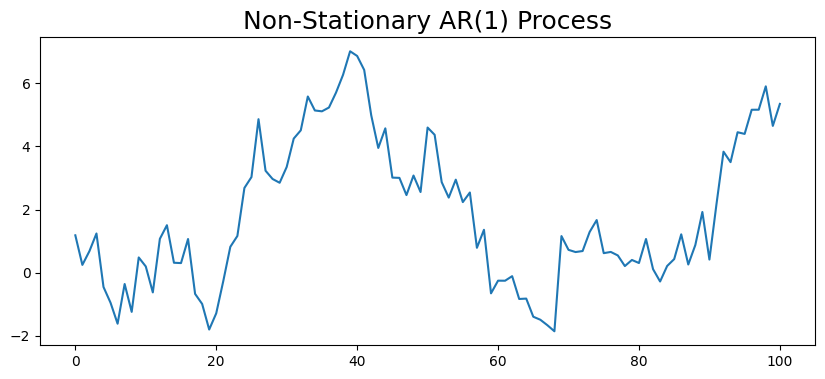
ar_1_process_unit_root = generate_ar_process(1, [1], 100)
plt.figure(figsize=(10,4))
plt.plot(ar_1_process_unit_root)
plt.title('Non-Stationary AR(1) Process', fontsize=18)
Text(0.5, 1.0, 'Non-Stationary AR(1) Process')

perform_adf_test(ar_1_process_unit_root)
ADF Statistic: -1.768932
p-value: 0.395991
AR(2) Process#
Stationary#
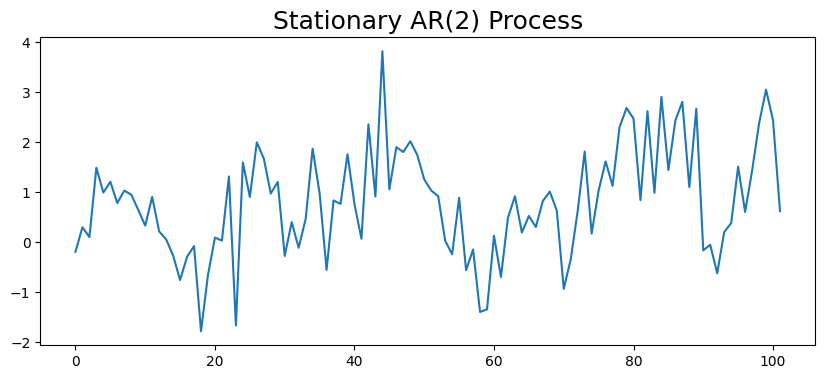
ar_2_process = generate_ar_process(2, [.5, .3], 100)
plt.figure(figsize=(10,4))
plt.plot(ar_2_process)
plt.title('Stationary AR(2) Process', fontsize=18)
Text(0.5, 1.0, 'Stationary AR(2) Process')

perform_adf_test(ar_2_process)
ADF Statistic: -3.015991
p-value: 0.033428
Non-Stationary#
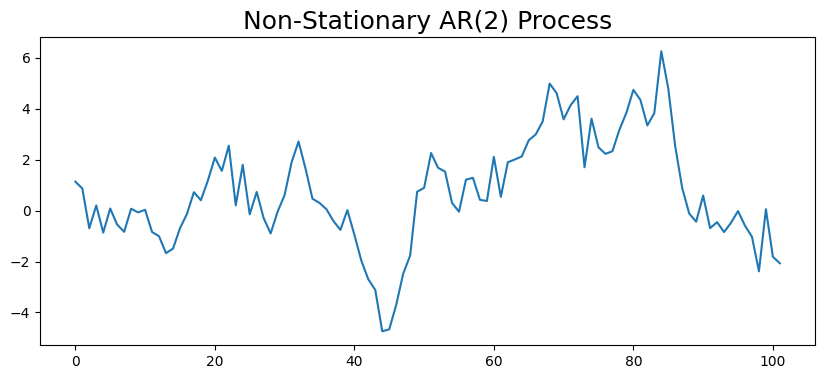
ar_2_process_unit_root = generate_ar_process(2, [.7, .3], 100)
plt.figure(figsize=(10,4))
plt.plot(ar_2_process_unit_root)
plt.title('Non-Stationary AR(2) Process', fontsize=18)
Text(0.5, 1.0, 'Non-Stationary AR(2) Process')

perform_adf_test(ar_2_process_unit_root)
ADF Statistic: -2.427619
p-value: 0.134092

