import pandas as pd
import numpy as np
import matplotlib.pyplot as plt
from datetime import datetime
from datetime import timedelta
from pandas.plotting import register_matplotlib_converters
from statsmodels.tsa.stattools import acf, pacf
from statsmodels.tsa.arima.model import ARIMA
register_matplotlib_converters()
from time import time
8: ARMa Model#
def parser(s):
    return datetime.strptime(s, '%Y-%m-%d')
# Catfish Sales Data
#read data
catfish_sales = pd.read_csv('../data/catfish.csv', parse_dates=[0], index_col=0, squeeze=True, date_parser=parser)
/tmp/ipykernel_3775839/2935818357.py:2: FutureWarning: The squeeze argument has been deprecated and will be removed in a future version. Append .squeeze("columns") to the call to squeeze.


  catfish_sales = pd.read_csv('../data/catfish.csv', parse_dates=[0], index_col=0, squeeze=True, date_parser=parser)
#infer the frequency of the data
catfish_sales = catfish_sales.asfreq(pd.infer_freq(catfish_sales.index))
start_date = datetime(2000,1,1)
end_date = datetime(2004,1,1)
lim_catfish_sales = catfish_sales[start_date:end_date]
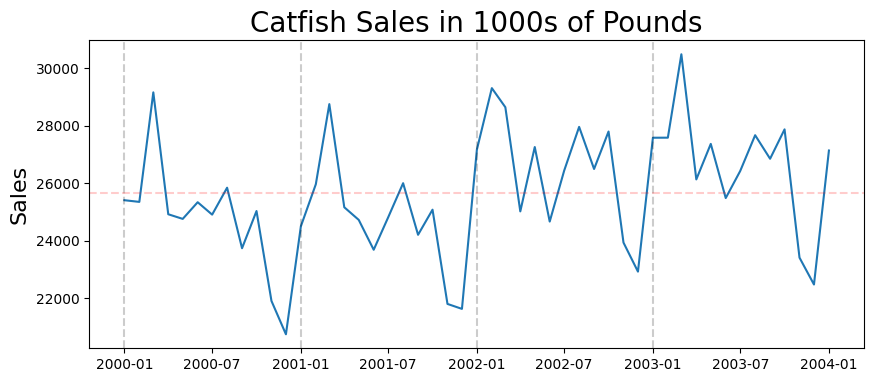
plt.figure(figsize=(10,4))
plt.plot(lim_catfish_sales)
plt.title('Catfish Sales in 1000s of Pounds', fontsize=20)
plt.ylabel('Sales', fontsize=16)
for year in range(start_date.year,end_date.year):
    plt.axvline(pd.to_datetime(str(year)+'-01-01'), color='k', linestyle='--', alpha=0.2)
plt.axhline(lim_catfish_sales.mean(), color='r', alpha=0.2, linestyle='--')
<matplotlib.lines.Line2D at 0x7f1f08706820>
first_diff = lim_catfish_sales.diff()[1:]
acf_vals.shape
(17,)
acf_vals = acf(first_diff)
num_lags = 10
plt.bar(range(num_lags), acf_vals[:num_lags])
<BarContainer object of 10 artists>
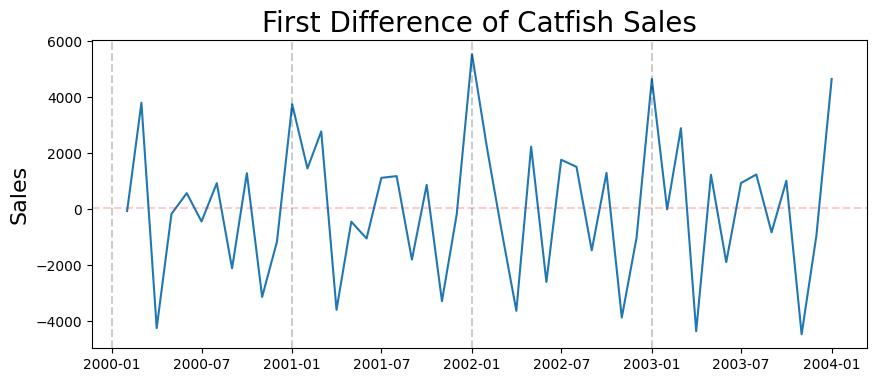
plt.figure(figsize=(10,4))
plt.plot(first_diff)
plt.title('First Difference of Catfish Sales', fontsize=20)
plt.ylabel('Sales', fontsize=16)
for year in range(start_date.year,end_date.year):
    plt.axvline(pd.to_datetime(str(year)+'-01-01'), color='k', linestyle='--', alpha=0.2)
plt.axhline(first_diff.mean(), color='r', alpha=0.2, linestyle='--')
<matplotlib.lines.Line2D at 0x7f1efe8b65b0>
ACF#
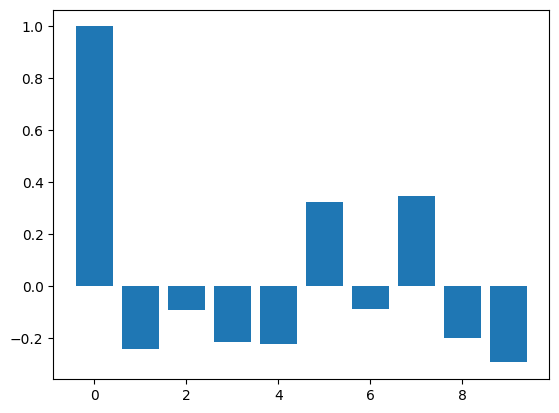
Based on ACF, we should start with a MA(1) process#
PACF#
pacf_vals = pacf(first_diff)
plt.bar(range(num_lags), pacf_vals[:num_lags])
<BarContainer object of 10 artists>
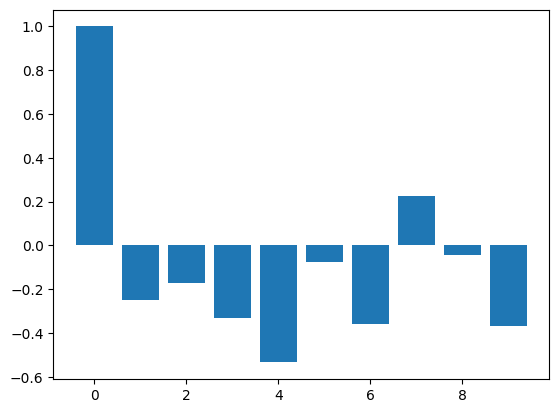
Based on PACF, we should start with a AR(4) process#
Get training and testing sets#
train_end = datetime(2003,7,1)
test_end = datetime(2004,1,1)

train_data = first_diff[:train_end]
test_data = first_diff[train_end + timedelta(days=1):test_end]
Fit the ARMA Model#
# define model
model = ARIMA(train_data, order=(4,1,0))
#fit the model
start = time()
model_fit = model.fit()
end = time()
print('Model Fitting Time:', end - start)
Model Fitting Time: 0.036299705505371094
#summary of the model
print(model_fit.summary())
                               SARIMAX Results
==============================================================================
Dep. Variable:                  Total   No. Observations:                   42
Model:                 ARIMA(4, 1, 0)   Log Likelihood                -377.949
Date:                Wed, 22 Mar 2023   AIC                            765.898
Time:                        13:02:56   BIC                            774.465
Sample:                    02-01-2000   HQIC                           769.018
                         - 07-01-2003
Covariance Type:                  opg
==============================================================================
                 coef    std err          z      P>|z|      [0.025      0.975]
------------------------------------------------------------------------------
ar.L1         -0.9224      0.146     -6.315      0.000      -1.209      -0.636
ar.L2         -0.6459      0.165     -3.905      0.000      -0.970      -0.322
ar.L3         -0.6608      0.177     -3.724      0.000      -1.009      -0.313
ar.L4         -0.6099      0.134     -4.558      0.000      -0.872      -0.348
sigma2      5.563e+06   1.45e+06      3.848      0.000    2.73e+06     8.4e+06
===================================================================================
Ljung-Box (L1) (Q):                   0.50   Jarque-Bera (JB):                 0.57
Prob(Q):                              0.48   Prob(JB):                         0.75
Heteroskedasticity (H):               1.23   Skew:                             0.28
Prob(H) (two-sided):                  0.70   Kurtosis:                         2.90
===================================================================================

Warnings:
[1] Covariance matrix calculated using the outer product of gradients (complex-step).
So the ARMA(4,1) model is:#
\(\hat{y_t} = -0.87y_{t-1} - 0.42y_{t-2} - 0.56y_{t-3} - 0.61y_{t-4} + 0.52\varepsilon_{t-1}\)#
#get prediction start and end dates
pred_start_date = test_data.index[0]
pred_end_date = test_data.index[-1]
#get the predictions and residuals
predictions = model_fit.predict(start=pred_start_date, end=pred_end_date)
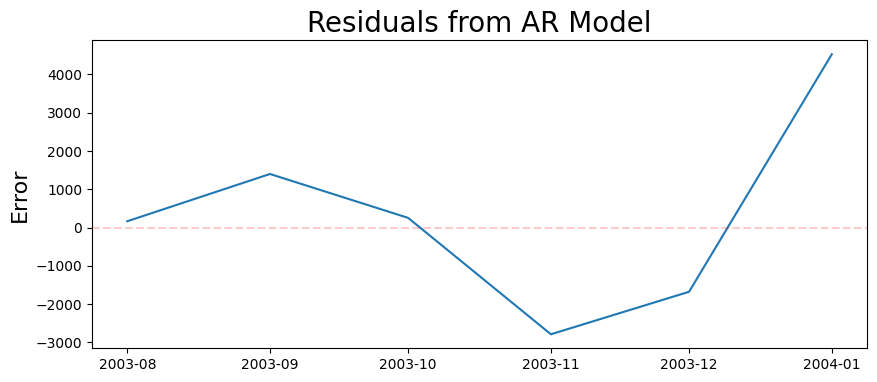
residuals = test_data - predictions
plt.figure(figsize=(10,4))
plt.plot(residuals)
plt.title('Residuals from AR Model', fontsize=20)
plt.ylabel('Error', fontsize=16)
plt.axhline(0, color='r', linestyle='--', alpha=0.2)
<matplotlib.lines.Line2D at 0x7f1efe8357f0>
plt.figure(figsize=(10,4))

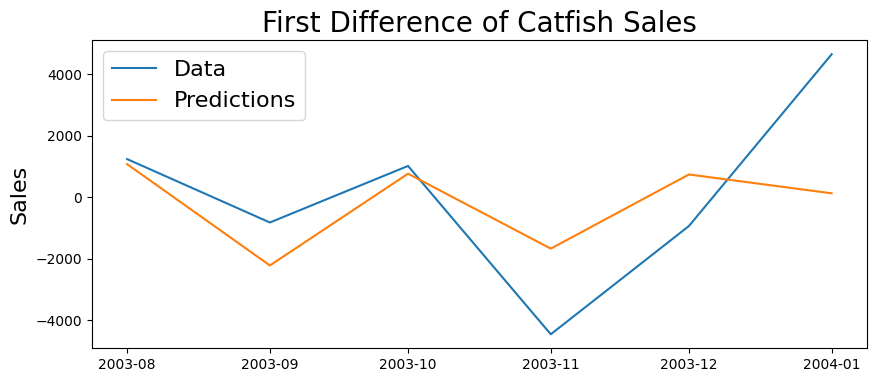
plt.plot(test_data)
plt.plot(predictions)

plt.legend(('Data', 'Predictions'), fontsize=16)

plt.title('First Difference of Catfish Sales', fontsize=20)
plt.ylabel('Sales', fontsize=16)
Text(0, 0.5, 'Sales')
print('Root Mean Squared Error:', np.sqrt(np.mean(residuals**2)))
Root Mean Squared Error: 2350.1523951992594

