12: Granger Causality#
from statsmodels.tsa.stattools import grangercausalitytests
import numpy as np
import pandas as pd
import matplotlib.pyplot as plt
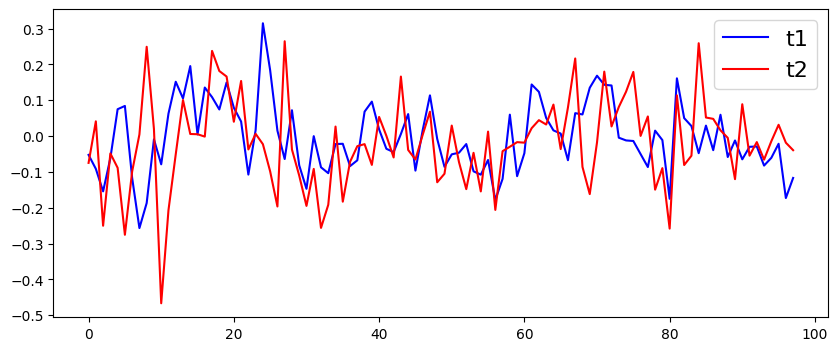
#build the time series, just a simple AR(1)
t1 = [0.1*np.random.normal()]
for _ in range(100):
    t1.append(0.5*t1[-1] + 0.1*np.random.normal())
#build the time series that is granger caused by t1
t2 = [item + 0.1*np.random.normal() for item in t1]
#adjust t1 and t2
t1 = t1[3:]
t2 = t2[:-3]
plt.figure(figsize=(10,4))
plt.plot(t1, color='b')
plt.plot(t2, color='r')

plt.legend(['t1', 't2'], fontsize=16)
<matplotlib.legend.Legend at 0x7fc1d5f71d90>
ts_df = pd.DataFrame(columns=['t2', 't1'], data=zip(t2,t1))
ts_df
| t2 | t1 | |
|---|---|---|
| 0 | -0.074890 | -0.052559 |
| 1 | 0.041190 | -0.091463 |
| 2 | -0.250354 | -0.154409 |
| 3 | -0.048394 | -0.061625 |
| 4 | -0.088648 | 0.075002 |
| ... | ... | ... |
| 93 | -0.065850 | -0.082384 |
| 94 | -0.014395 | -0.060732 |
| 95 | 0.031564 | -0.021469 |
| 96 | -0.018472 | -0.173017 |
| 97 | -0.039406 | -0.116893 |
98 rows × 2 columns
gc_res = grangercausalitytests(ts_df, 3)
Granger Causality
number of lags (no zero) 1
ssr based F test:         F=0.0378  , p=0.8462  , df_denom=94, df_num=1
ssr based chi2 test:   chi2=0.0391  , p=0.8433  , df=1
likelihood ratio test: chi2=0.0390  , p=0.8434  , df=1
parameter F test:         F=0.0378  , p=0.8462  , df_denom=94, df_num=1

Granger Causality
number of lags (no zero) 2
ssr based F test:         F=4.5927  , p=0.0126  , df_denom=91, df_num=2
ssr based chi2 test:   chi2=9.6901  , p=0.0079  , df=2
likelihood ratio test: chi2=9.2317  , p=0.0099  , df=2
parameter F test:         F=4.5927  , p=0.0126  , df_denom=91, df_num=2

Granger Causality
number of lags (no zero) 3
ssr based F test:         F=19.5546 , p=0.0000  , df_denom=88, df_num=3
ssr based chi2 test:   chi2=63.3302 , p=0.0000  , df=3
likelihood ratio test: chi2=48.5265 , p=0.0000  , df=3
parameter F test:         F=19.5546 , p=0.0000  , df_denom=88, df_num=3