from arch.univariate import arch_model
from statsmodels.graphics.tsaplots import plot_acf, plot_pacf
import pandas as pd
import numpy as np
from random import gauss, seed
seed(10)

import matplotlib.pyplot as plt
from tqdm import tqdm
import warnings
warnings.filterwarnings("ignore")
02- Volatility prediction: Simulated Data#
Simulate the time series#
# create dataset
n = 1000
omega = 0.5

alpha_1 = 0.1
alpha_2 = 0.2

beta_1 = 0.3
beta_2 = 0.4

test_size = int(n*0.1)

series = [gauss(0,1), gauss(0,1)]
vols = [1, 1]

for _ in range(n):
    new_vol = np.sqrt(omega + alpha_1*series[-1]**2 + alpha_2*series[-2]**2 + beta_1*vols[-1]**2 + beta_2*vols[-2]**2)
    new_val = gauss(0,1) * new_vol

    vols.append(new_vol)
    series.append(new_val)
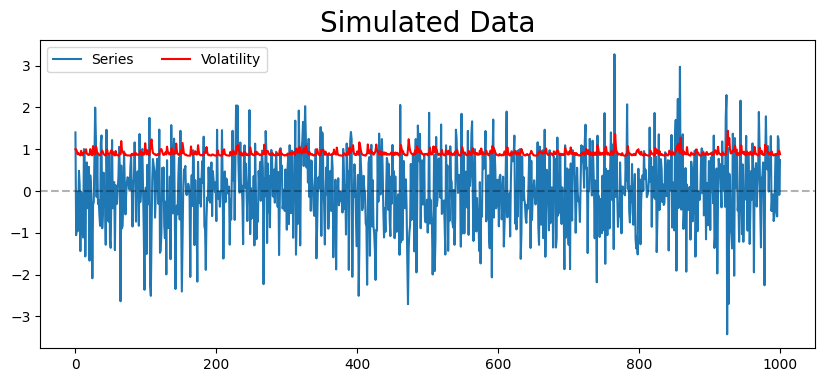
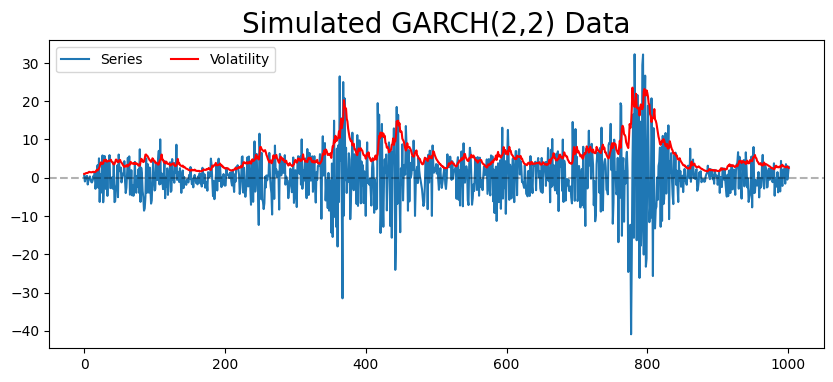
plt.figure(figsize=(10,4))
plt.plot(series, label='Series')
plt.plot(vols, color='red', label='Volatility')
plt.axhline(0, ls='--', alpha=0.3, color='k')
plt.legend(ncol=2, loc='best')
plt.title('Simulated GARCH(2,2) Data', fontsize=20)
plt.show()
PACF and ACF Plots#
Exercise 1:
Plot the PACF of the innovation
Plot the PACF of squared innovation
What are the two properties you are seeing in the graphs
Exercise 2:
Do the same for the ACF
Fit and Test models#
Separate the training set from the testing set#
train, test = series[:-test_size], series[-test_size:]
Fit the best GARCH Model= GARCH (2,2)#
model = arch_model(train, mean='Zero', p=2, o=0, q=2)
model_fit = model.fit(disp='off')
constant_params = model_fit.params
print(model_fit.summary())
                       Zero Mean - GARCH Model Results
==============================================================================
Dep. Variable:                      y   R-squared:                       0.000
Mean Model:                 Zero Mean   Adj. R-squared:                  0.001
Vol Model:                      GARCH   Log-Likelihood:               -2833.59
Distribution:                  Normal   AIC:                           5677.18
Method:            Maximum Likelihood   BIC:                           5701.21
                                        No. Observations:                  902
Date:                Tue, Apr 18 2023   Df Residuals:                      902
Time:                        14:12:41   Df Model:                            0
                             Volatility Model
==========================================================================
                 coef    std err          t      P>|t|    95.0% Conf. Int.
--------------------------------------------------------------------------
omega          0.5187      0.216      2.396  1.658e-02 [9.437e-02,  0.943]
alpha[1]       0.1373  4.413e-02      3.111  1.863e-03 [5.081e-02,  0.224]
alpha[2]       0.1961  3.813e-02      5.142  2.713e-07   [  0.121,  0.271]
beta[1]    2.7887e-14      0.171  1.635e-13      1.000   [ -0.334,  0.334]
beta[2]        0.6666      0.134      4.981  6.335e-07   [  0.404,  0.929]
==========================================================================

Covariance estimator: robust
fitted_paramters = constant_params.rename(‘Fitted Parameters’).to_frame() fitted_paramters[‘true_params’] = [0.5, 0.1, 0.2, 0.3, 0.4] fitted_paramters
Even when we know the data generating process it is difficult to get back the exact parameters of ARCH ARCH estimation is based on maximum likelihood. The more there are parameters to estimate, the more difficult it becomes
Predict#
test_size
100
predictions = model_fit.forecast(horizon=test_size)
Predict the mean ?#
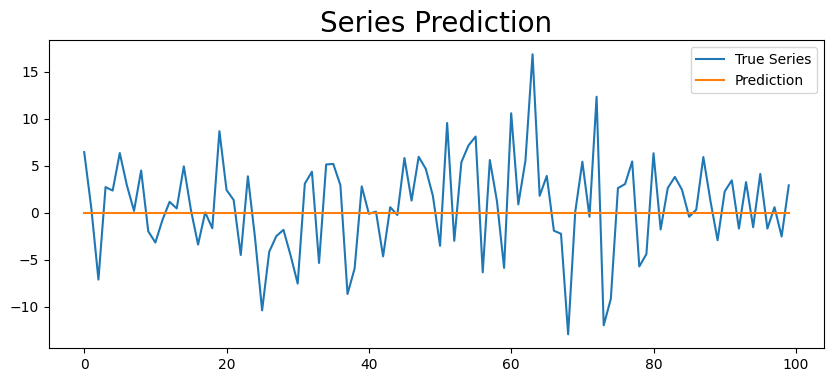
plt.figure(figsize=(10,4))
#true, = plt.plot(series[-test_size:], label='True Series')
true, = plt.plot(series[-test_size:], label='True Series')
preds, = plt.plot(np.sqrt(predictions.mean.values[-1, :]), label='Prediction')

plt.legend(loc='best')
plt.title('Series Prediction', fontsize=20)
plt.show()
plt.figure(figsize=(10,4))
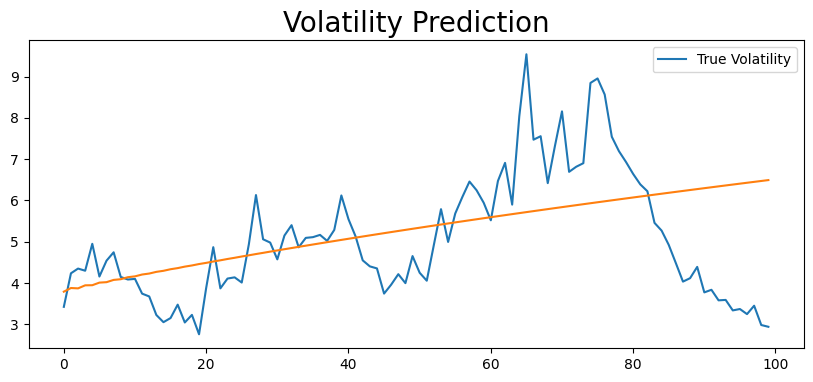
true, = plt.plot(vols[-test_size:], label='True Volatility')
preds, = plt.plot(np.sqrt(predictions.variance.values[-1, :]))

plt.legend(loc='best')
plt.title('Volatility Prediction', fontsize=20)
plt.show()
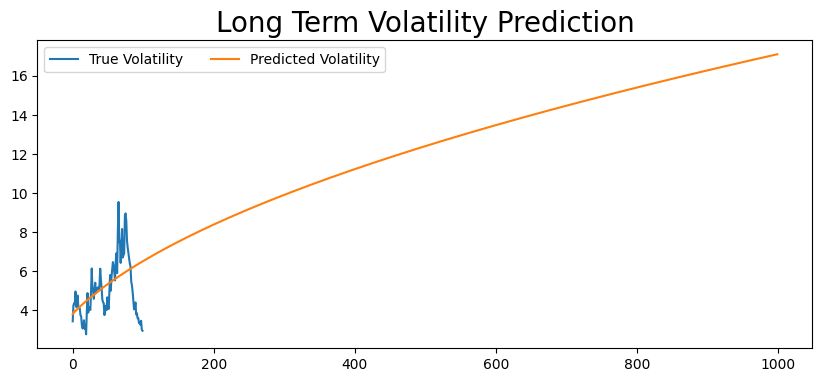
predictions_long_term = model_fit.forecast(horizon=1000)
plt.figure(figsize=(10,4))
true, = plt.plot(vols[-test_size:], label='True Volatility')
preds, = plt.plot(np.sqrt(predictions_long_term.variance.values[-1, :]), label='Predicted Volatility')
plt.legend(ncol=2)
plt.title('Long Term Volatility Prediction', fontsize=20)
plt.show()
Rolling Forecast Origin#
rolling_predictions = []
params = {}
for i in tqdm(range(test_size)):
    train = series[:-(test_size-i)]
    model = arch_model(train, mean='Zero', p=2, q=2)
    model_fit = model.fit(disp='off')
    params[i] = model_fit.params
    pred = model_fit.forecast(horizon=1)
    rolling_predictions.append(np.sqrt(pred.variance.values[-1,:][0]))
params = pd.concat(params.values(), keys=params.keys(), axis=1).T
100%|██████████| 100/100 [00:03<00:00, 26.55it/s]
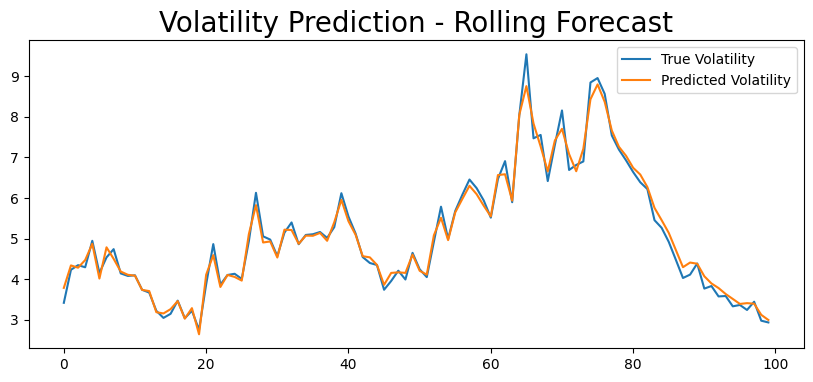
plt.figure(figsize=(10,4))
true, = plt.plot(vols[-test_size:], label = 'True Volatility')
preds, = plt.plot(rolling_predictions, label = 'Predicted Volatility')
plt.legend(loc='best')
plt.title('Volatility Prediction - Rolling Forecast', fontsize=20)
plt.show()
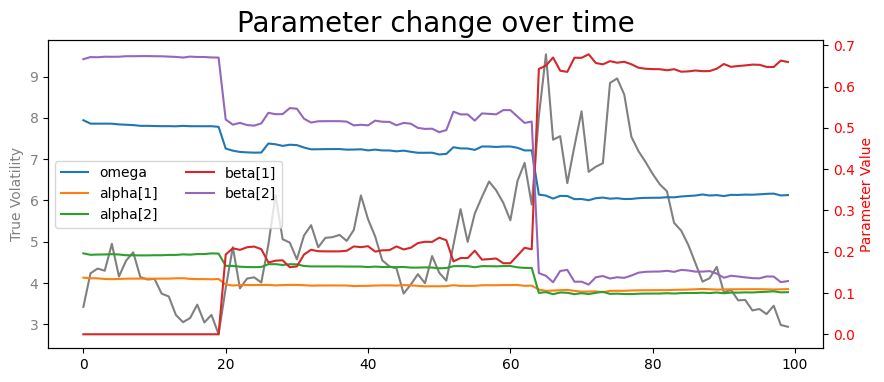
fig, ax1 = plt.subplots(figsize=(10, 4))

# plot the first plot on the left axis
ax1.plot(vols[-test_size:], label='True Volatility', color='grey')
ax1.set_ylabel('True Volatility', color='grey')
ax1.tick_params(axis='y', labelcolor='grey')

# create a twin axis for the second plot on the right
ax2 = ax1.twinx()

# plot the second plot on the right axis
ax2.plot(params)
ax2.set_ylabel('Parameter Value', color='red')
ax2.tick_params(axis='y', labelcolor='red')

# add a title and legend
plt.title('Parameter change over time', fontsize=20)
plt.legend( list(params.columns), ncol=2, loc='best')

plt.show()
Conclusion#
Note that the GARCH have no effect on the conditional mean, but only on the conditional volatility
The best usage of the Garch model prediction, as any time-series model is to re-estimate the parameters every day and predict 1 step ahead
Parameters update take the recent sudden changes in volatility
Exercises 1:#
Now Fit an ARCH (3) model on the above timeseries
Interprete the results
Exercises 1:#
Now Fit an GARCH (3,3) model on the above timeseries
Interprete the results
def generate_process(omega, alphas, betas, sample_size=1000):
    '''
    Generate the process following GARCH (p,q)
    '''
    n = sample_size
    p = len(alphas)
    q = len(betas)
    # Initionalizing the process
    series = []
    for _ in range(p):
        series.append(gauss(0,1))

    vols = list(np.ones(q))

    # Replicate the GARCH dynamic
    for _ in range(n):
        new_var = omega
        for i in range(p):
            new_var = new_var + alphas[i]*series[-1-i]**2
        for i in range(q):
            new_var = new_var + betas[i]*vols[-1-i]**2
        new_vol = np.sqrt(new_var)
        new_val = gauss(0,1) * new_vol

        vols.append(new_vol)
        series.append(new_val)

    return vols, series

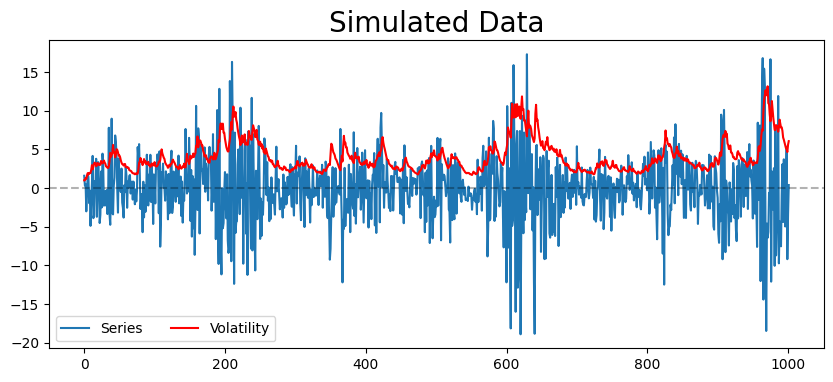
def plot_process(vols, series, title='Simulated Data'):
    plt.figure(figsize=(10,4))
    plt.plot(series, label='Series')
    plt.plot(vols, color='red', label='Volatility')
    plt.axhline(0, ls='--', alpha=0.3, color='k')
    plt.legend(ncol=2, loc='best')
    plt.title(title, fontsize=20)
    plt.show()
vols, series = generate_process(.5, [0.1, 0.2], [0.3, 0.4])
plot_process(vols, series)
vols, series = generate_process(.5, [0.1], [0.3])
plot_process(vols, series)
