import pandas as pd
from datetime import datetime
import matplotlib.pyplot as plt
from statsmodels.graphics.tsaplots import plot_acf, plot_pacf
from statsmodels.tsa.api import VAR
from scipy.stats import pearsonr
13: VAR Model#
def parser(s):
    return datetime.strptime(s, '%Y-%m')
ice_cream_heater_df = pd.read_csv('../data/ice_cream_vs_heater.csv', parse_dates=[0], index_col=0, squeeze=True, date_parser=parser)
/tmp/ipykernel_3777724/10753663.py:1: FutureWarning: The squeeze argument has been deprecated and will be removed in a future version. Append .squeeze("columns") to the call to squeeze.


  ice_cream_heater_df = pd.read_csv('../data/ice_cream_vs_heater.csv', parse_dates=[0], index_col=0, squeeze=True, date_parser=parser)
ice_cream_heater_df = ice_cream_heater_df.asfreq(pd.infer_freq(ice_cream_heater_df.index))
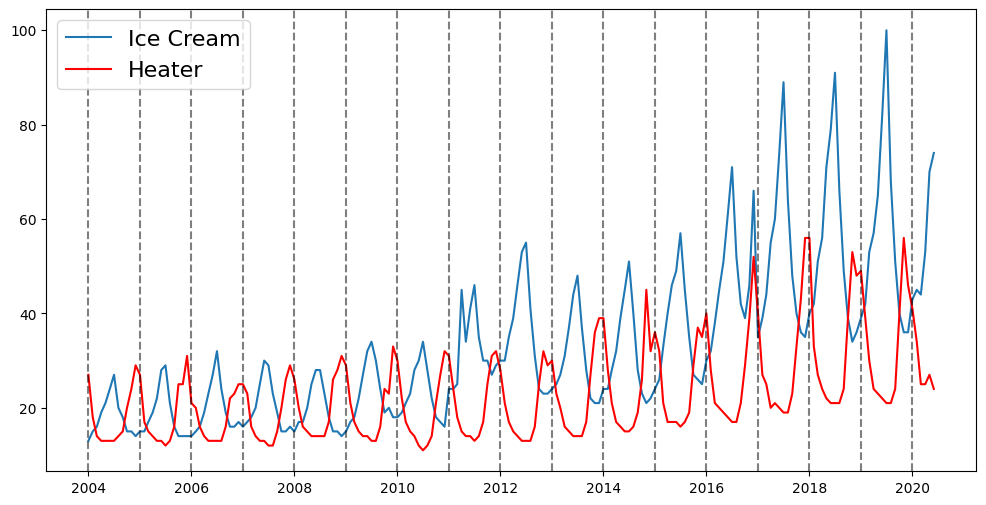
plt.figure(figsize=(12,6))
ice_cream, = plt.plot(ice_cream_heater_df['ice cream'])
heater, = plt.plot(ice_cream_heater_df['heater'], color='red')

for year in range(2004, 2021):
    plt.axvline(datetime(year,1,1), linestyle='--', color='k', alpha=0.5)

plt.legend(['Ice Cream', 'Heater'], fontsize=16)
<matplotlib.legend.Legend at 0x7f12641759d0>
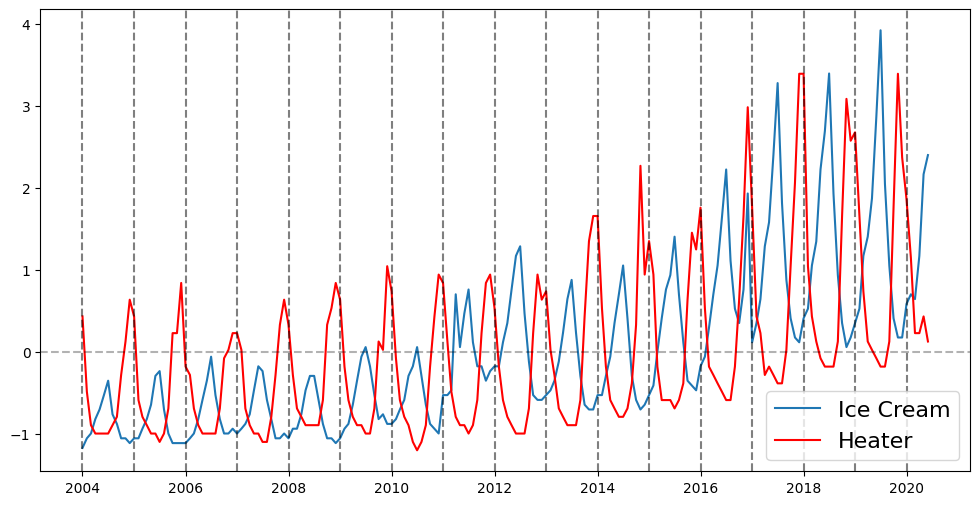
Normalize#
avgs = ice_cream_heater_df.mean()
devs = ice_cream_heater_df.std()
for col in ice_cream_heater_df.columns:
    ice_cream_heater_df[col] = (ice_cream_heater_df[col] - avgs.loc[col]) / devs.loc[col]
plt.figure(figsize=(12,6))
ice_cream, = plt.plot(ice_cream_heater_df['ice cream'])
heater, = plt.plot(ice_cream_heater_df['heater'], color='red')

for year in range(2004, 2021):
    plt.axvline(datetime(year,1,1), linestyle='--', color='k', alpha=0.5)

plt.axhline(0, linestyle='--', color='k', alpha=0.3)

plt.legend(['Ice Cream', 'Heater'], fontsize=16)
<matplotlib.legend.Legend at 0x7f12620bbbe0>
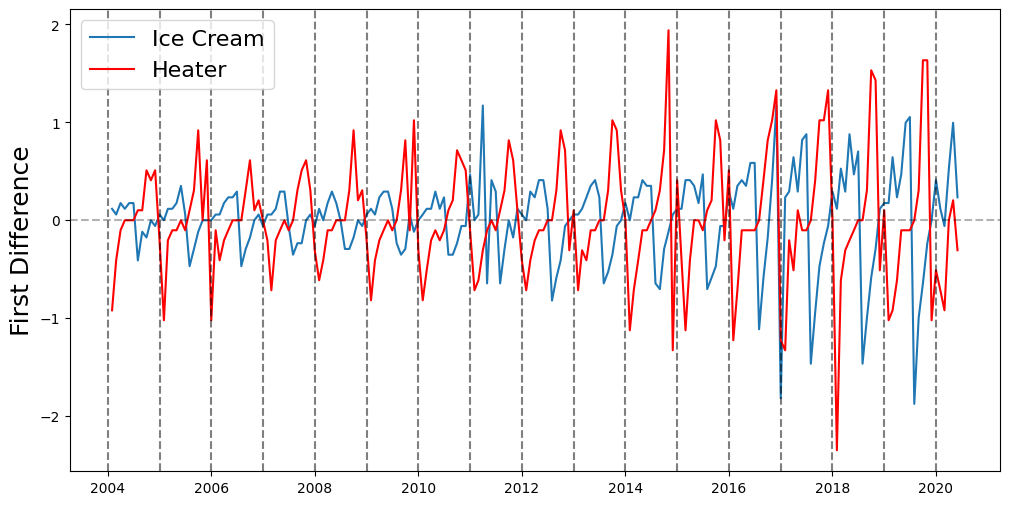
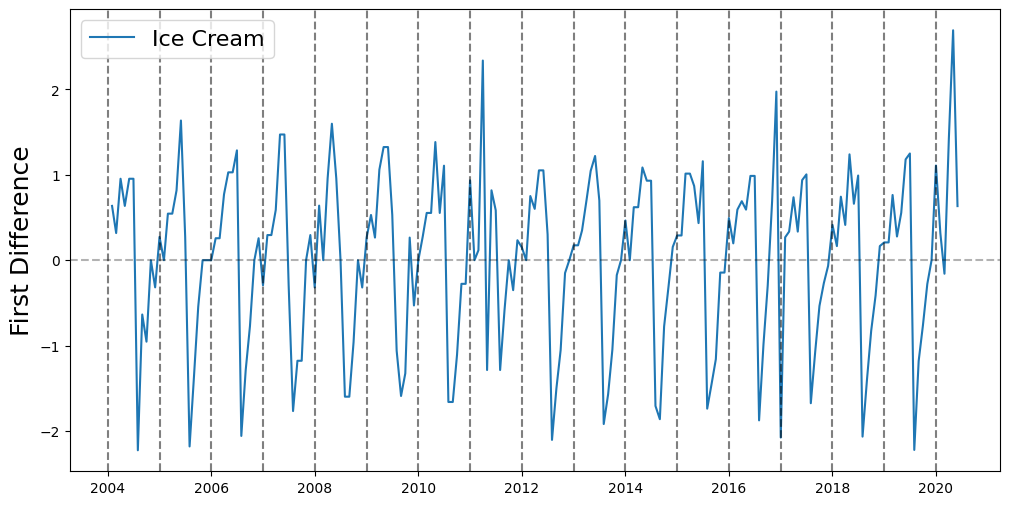
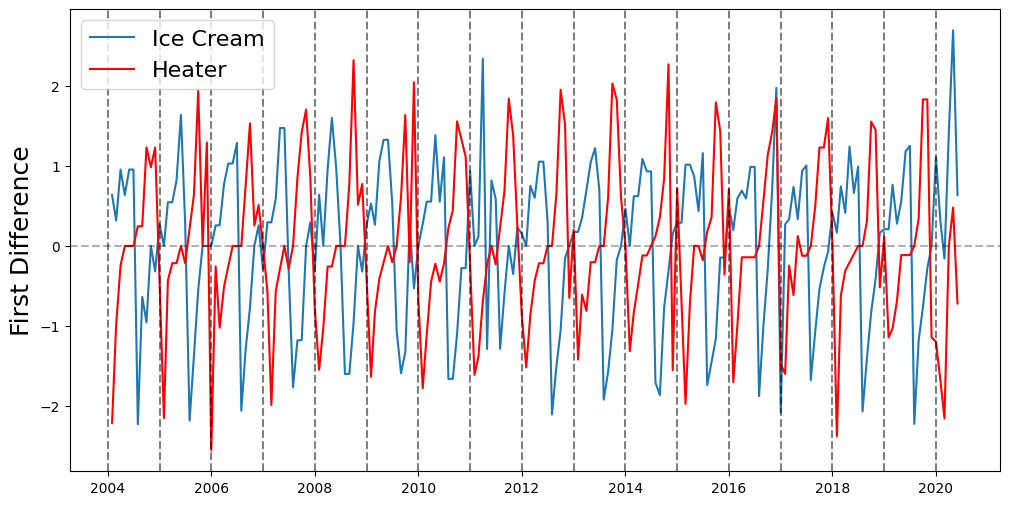
Take First Difference to Remove Trend#
ice_cream_heater_df = ice_cream_heater_df.diff().dropna()
plt.figure(figsize=(12,6))
ice_cream, = plt.plot(ice_cream_heater_df['ice cream'])
heater, = plt.plot(ice_cream_heater_df['heater'], color='red')

for year in range(2004, 2021):
    plt.axvline(datetime(year,1,1), linestyle='--', color='k', alpha=0.5)

plt.axhline(0, linestyle='--', color='k', alpha=0.3)
plt.ylabel('First Difference', fontsize=18)

plt.legend(['Ice Cream', 'Heater'], fontsize=16)
<matplotlib.legend.Legend at 0x7f1261fc3f10>
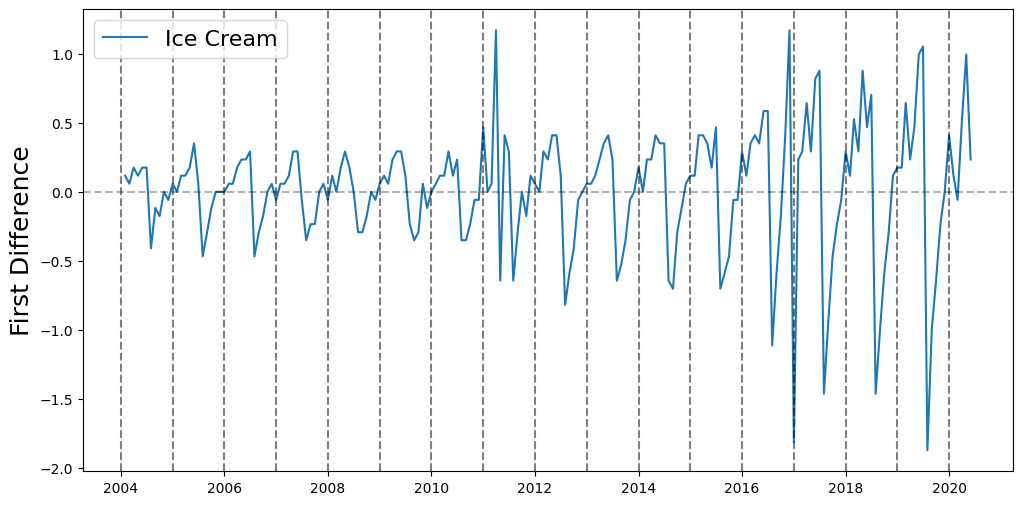
plt.figure(figsize=(12,6))
ice_cream, = plt.plot(ice_cream_heater_df['ice cream'])

for year in range(2004, 2021):
    plt.axvline(datetime(year,1,1), linestyle='--', color='k', alpha=0.5)

plt.axhline(0, linestyle='--', color='k', alpha=0.3)
plt.ylabel('First Difference', fontsize=18)

plt.legend(['Ice Cream'], fontsize=16)
<matplotlib.legend.Legend at 0x7f1261f15520>
Remove Increasing Volatility#
annual_volatility = ice_cream_heater_df.groupby(ice_cream_heater_df.index.year).std()
annual_volatility
| heater | ice cream | |
|---|---|---|
| Month | ||
| 2004 | 0.415481 | 0.184201 |
| 2005 | 0.474527 | 0.214837 |
| 2006 | 0.400148 | 0.227698 |
| 2007 | 0.359839 | 0.198947 |
| 2008 | 0.396182 | 0.183239 |
| 2009 | 0.499810 | 0.221038 |
| 2010 | 0.459566 | 0.211668 |
| 2011 | 0.443924 | 0.501018 |
| 2012 | 0.471104 | 0.389711 |
| 2013 | 0.503587 | 0.335840 |
| 2014 | 0.855743 | 0.377482 |
| 2015 | 0.569441 | 0.404340 |
| 2016 | 0.719843 | 0.593347 |
| 2017 | 0.830886 | 0.874263 |
| 2018 | 0.987221 | 0.708785 |
| 2019 | 0.892991 | 0.843598 |
| 2020 | 0.426657 | 0.369810 |
ice_cream_heater_df['ice_cream_annual_vol'] = ice_cream_heater_df.index.map(lambda d: annual_volatility.loc[d.year, 'ice cream'])
ice_cream_heater_df['heater_annual_vol'] = ice_cream_heater_df.index.map(lambda d: annual_volatility.loc[d.year, 'heater'])
ice_cream_heater_df
| heater | ice cream | ice_cream_annual_vol | heater_annual_vol | |
|---|---|---|---|---|
| Month | ||||
| 2004-02-01 | -0.918789 | 0.117140 | 0.184201 | 0.415481 |
| 2004-03-01 | -0.408351 | 0.058570 | 0.184201 | 0.415481 |
| 2004-04-01 | -0.102088 | 0.175710 | 0.184201 | 0.415481 |
| 2004-05-01 | 0.000000 | 0.117140 | 0.184201 | 0.415481 |
| 2004-06-01 | 0.000000 | 0.175710 | 0.184201 | 0.415481 |
| ... | ... | ... | ... | ... |
| 2020-02-01 | -0.714614 | 0.117140 | 0.369810 | 0.426657 |
| 2020-03-01 | -0.918789 | -0.058570 | 0.369810 | 0.426657 |
| 2020-04-01 | 0.000000 | 0.527129 | 0.369810 | 0.426657 |
| 2020-05-01 | 0.204175 | 0.995687 | 0.369810 | 0.426657 |
| 2020-06-01 | -0.306263 | 0.234279 | 0.369810 | 0.426657 |
197 rows × 4 columns
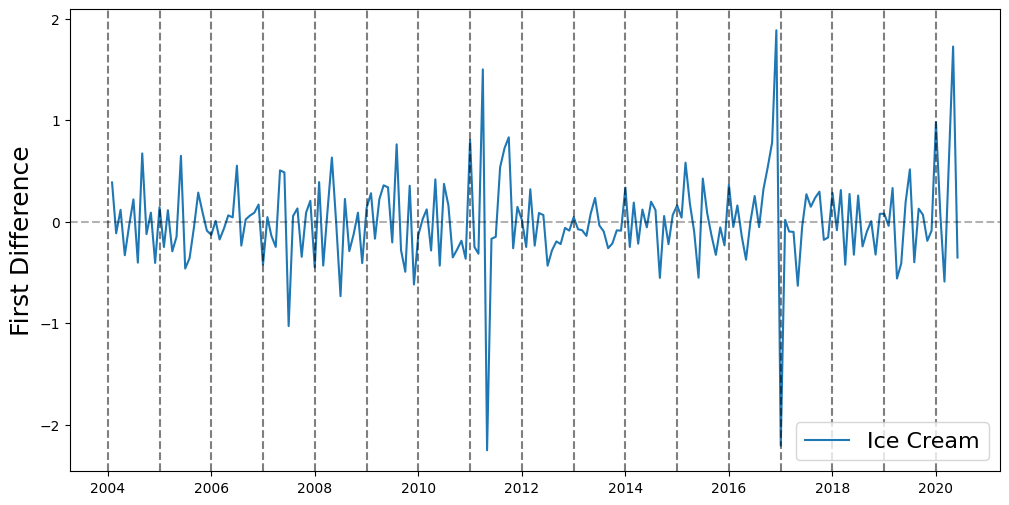
ice_cream_heater_df['ice cream'] = ice_cream_heater_df['ice cream'] / ice_cream_heater_df['ice_cream_annual_vol']
ice_cream_heater_df['heater'] = ice_cream_heater_df['heater'] / ice_cream_heater_df['heater_annual_vol']
plt.figure(figsize=(12,6))
ice_cream, = plt.plot(ice_cream_heater_df['ice cream'])

for year in range(2004, 2021):
    plt.axvline(datetime(year,1,1), linestyle='--', color='k', alpha=0.5)

plt.axhline(0, linestyle='--', color='k', alpha=0.3)
plt.ylabel('First Difference', fontsize=18)

plt.legend(['Ice Cream'], fontsize=16)
<matplotlib.legend.Legend at 0x7f1261bb7a00>
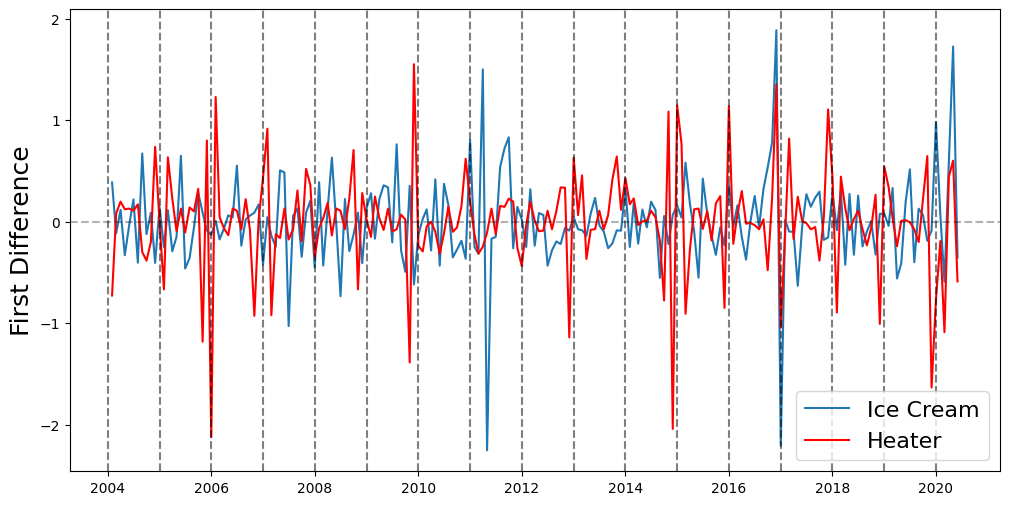
plt.figure(figsize=(12,6))
ice_cream, = plt.plot(ice_cream_heater_df['ice cream'])
heater, = plt.plot(ice_cream_heater_df['heater'], color='red')

for year in range(2004, 2021):
    plt.axvline(datetime(year,1,1), linestyle='--', color='k', alpha=0.5)

plt.axhline(0, linestyle='--', color='k', alpha=0.3)
plt.ylabel('First Difference', fontsize=18)

plt.legend(['Ice Cream', 'Heater'], fontsize=16)
<matplotlib.legend.Legend at 0x7f1261af2af0>
Remove Seasonality#
month_avgs = ice_cream_heater_df.groupby(ice_cream_heater_df.index.month).mean()
print(month_avgs)
         heater  ice cream  ice_cream_annual_vol  heater_annual_vol
Month
1     -0.428360   0.130345              0.415976           0.580717
2     -1.483129   0.250194              0.402342           0.570997
3     -1.063595   0.433016              0.402342           0.570997
4     -0.442926   0.838085              0.402342           0.570997
5     -0.121663   0.967273              0.402342           0.570997
6     -0.128425   0.987311              0.402342           0.570997
7     -0.107093   0.735052              0.404376           0.580018
8      0.075720  -1.821285              0.404376           0.580018
9      0.544638  -1.307661              0.404376           0.580018
10     1.613170  -0.830889              0.404376           0.580018
11     1.183118  -0.088136              0.404376           0.580018
12     0.491641   0.088998              0.404376           0.580018
ice_cream_heater_df['ice_cream_month_avg'] = ice_cream_heater_df.index.map(lambda d: month_avgs.loc[d.month, 'ice cream'])
ice_cream_heater_df['heater_month_avg'] = ice_cream_heater_df.index.map(lambda d: month_avgs.loc[d.month, 'heater'])
ice_cream_heater_df
| heater | ice cream | ice_cream_annual_vol | heater_annual_vol | ice_cream_month_avg | heater_month_avg | |
|---|---|---|---|---|---|---|
| Month | ||||||
| 2004-02-01 | -2.211387 | 0.635934 | 0.184201 | 0.415481 | 0.250194 | -1.483129 |
| 2004-03-01 | -0.982838 | 0.317967 | 0.184201 | 0.415481 | 0.433016 | -1.063595 |
| 2004-04-01 | -0.245710 | 0.953901 | 0.184201 | 0.415481 | 0.838085 | -0.442926 |
| 2004-05-01 | 0.000000 | 0.635934 | 0.184201 | 0.415481 | 0.967273 | -0.121663 |
| 2004-06-01 | 0.000000 | 0.953901 | 0.184201 | 0.415481 | 0.987311 | -0.128425 |
| ... | ... | ... | ... | ... | ... | ... |
| 2020-02-01 | -1.674916 | 0.316756 | 0.369810 | 0.426657 | 0.250194 | -1.483129 |
| 2020-03-01 | -2.153463 | -0.158378 | 0.369810 | 0.426657 | 0.433016 | -1.063595 |
| 2020-04-01 | 0.000000 | 1.425403 | 0.369810 | 0.426657 | 0.838085 | -0.442926 |
| 2020-05-01 | 0.478547 | 2.692427 | 0.369810 | 0.426657 | 0.967273 | -0.121663 |
| 2020-06-01 | -0.717821 | 0.633512 | 0.369810 | 0.426657 | 0.987311 | -0.128425 |
197 rows × 6 columns
ice_cream_heater_df['ice cream'] = ice_cream_heater_df['ice cream'] - ice_cream_heater_df['ice_cream_month_avg']
ice_cream_heater_df['heater'] = ice_cream_heater_df['heater'] - ice_cream_heater_df['heater_month_avg']
ice_cream_heater_df
| heater | ice cream | ice_cream_annual_vol | heater_annual_vol | ice_cream_month_avg | heater_month_avg | |
|---|---|---|---|---|---|---|
| Month | ||||||
| 2004-02-01 | -0.728257 | 0.385740 | 0.184201 | 0.415481 | 0.250194 | -1.483129 |
| 2004-03-01 | 0.080757 | -0.115049 | 0.184201 | 0.415481 | 0.433016 | -1.063595 |
| 2004-04-01 | 0.197217 | 0.115816 | 0.184201 | 0.415481 | 0.838085 | -0.442926 |
| 2004-05-01 | 0.121663 | -0.331339 | 0.184201 | 0.415481 | 0.967273 | -0.121663 |
| 2004-06-01 | 0.128425 | -0.033411 | 0.184201 | 0.415481 | 0.987311 | -0.128425 |
| ... | ... | ... | ... | ... | ... | ... |
| 2020-02-01 | -0.191787 | 0.066562 | 0.369810 | 0.426657 | 0.250194 | -1.483129 |
| 2020-03-01 | -1.089868 | -0.591394 | 0.369810 | 0.426657 | 0.433016 | -1.063595 |
| 2020-04-01 | 0.442926 | 0.587318 | 0.369810 | 0.426657 | 0.838085 | -0.442926 |
| 2020-05-01 | 0.600210 | 1.725154 | 0.369810 | 0.426657 | 0.967273 | -0.121663 |
| 2020-06-01 | -0.589396 | -0.353799 | 0.369810 | 0.426657 | 0.987311 | -0.128425 |
197 rows × 6 columns
plt.figure(figsize=(12,6))
ice_cream, = plt.plot(ice_cream_heater_df['ice cream'])

for year in range(2004, 2021):
    plt.axvline(datetime(year,1,1), linestyle='--', color='k', alpha=0.5)

plt.axhline(0, linestyle='--', color='k', alpha=0.3)
plt.ylabel('First Difference', fontsize=18)

plt.legend(['Ice Cream'], fontsize=16)
<matplotlib.legend.Legend at 0x7f1260157fd0>
plt.figure(figsize=(12,6))
ice_cream, = plt.plot(ice_cream_heater_df['ice cream'])
heater, = plt.plot(ice_cream_heater_df['heater'], color='red')

for year in range(2004, 2021):
    plt.axvline(datetime(year,1,1), linestyle='--', color='k', alpha=0.5)

plt.axhline(0, linestyle='--', color='k', alpha=0.3)
plt.ylabel('First Difference', fontsize=18)

plt.legend(['Ice Cream', 'Heater'], fontsize=16)
<matplotlib.legend.Legend at 0x7f126009e610>
PACF - Heater#
plot_pacf(ice_cream_heater_df['heater'])
plt.show()
/home/ubuntu/Documents/Projects/STI_FX_Intervention/.venv/lib/python3.9/site-packages/statsmodels/graphics/tsaplots.py:348: FutureWarning: The default method 'yw' can produce PACF values outside of the [-1,1] interval. After 0.13, the default will change tounadjusted Yule-Walker ('ywm'). You can use this method now by setting method='ywm'.
  warnings.warn(
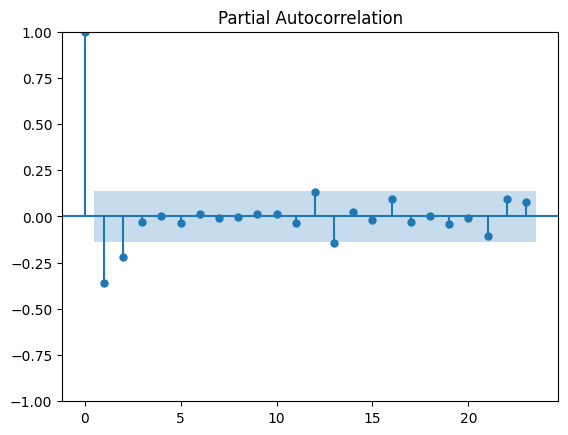
So consider an AR(2)#
Correlation between “heater” and lagged “ice cream”#
for lag in range(1, 14):
    heater_series = ice_cream_heater_df['heater'].iloc[lag:]
    lagged_ice_cream_series = ice_cream_heater_df['ice cream'].iloc[:-lag]
    print('Lag: %s'%lag)
    print(pearsonr(heater_series, lagged_ice_cream_series))
    print('------')
Lag: 1
PearsonRResult(statistic=-0.031544507425915636, pvalue=0.6607284991749385)
------
Lag: 2
PearsonRResult(statistic=-0.09872703210944635, pvalue=0.16970841905089779)
------
Lag: 3
PearsonRResult(statistic=-0.0017838553789235895, pvalue=0.9803056762960977)
------
Lag: 4
PearsonRResult(statistic=0.060239718598255415, pvalue=0.40529798325286276)
------
Lag: 5
PearsonRResult(statistic=-0.054034864480150276, pvalue=0.45664426275056963)
------
Lag: 6
PearsonRResult(statistic=0.06461183026553836, pvalue=0.3745300043445426)
------
Lag: 7
PearsonRResult(statistic=-0.04949334618415865, pvalue=0.49768766857620883)
------
Lag: 8
PearsonRResult(statistic=0.07890837135977341, pvalue=0.28045489704330623)
------
Lag: 9
PearsonRResult(statistic=-0.0532350169960043, pvalue=0.4681034202228026)
------
Lag: 10
PearsonRResult(statistic=0.029536989060791177, pvalue=0.6882054906333271)
------
Lag: 11
PearsonRResult(statistic=-0.059795363515225686, pvalue=0.41752174204856846)
------
Lag: 12
PearsonRResult(statistic=-0.07513046035981792, pvalue=0.3094409252542678)
------
Lag: 13
PearsonRResult(statistic=0.19808902198429754, pvalue=0.007029107082073456)
------
Fit a VAR Model#
ice_cream_heater_df = ice_cream_heater_df[['ice cream', 'heater']]
model = VAR(ice_cream_heater_df)
model_fit = model.fit(maxlags=13)
model_fit.summary()
  Summary of Regression Results
==================================
Model:                         VAR
Method:                        OLS
Date:           Wed, 22, Mar, 2023
Time:                     13:23:17
--------------------------------------------------------------------
No. of Equations:         2.00000    BIC:                   -1.92349
Nobs:                     184.000    HQIC:                  -2.48459
Log likelihood:          -204.405    FPE:                  0.0571123
AIC:                     -2.86700    Det(Omega_mle):       0.0434311
--------------------------------------------------------------------
Results for equation ice cream
================================================================================
                   coefficient       std. error           t-stat            prob
--------------------------------------------------------------------------------
const                -0.016054         0.034105           -0.471           0.638
L1.ice cream         -0.287811         0.079633           -3.614           0.000
L1.heater            -0.121251         0.073673           -1.646           0.100
L2.ice cream         -0.217862         0.087025           -2.503           0.012
L2.heater            -0.081992         0.079793           -1.028           0.304
L3.ice cream         -0.122169         0.090772           -1.346           0.178
L3.heater            -0.100743         0.080730           -1.248           0.212
L4.ice cream         -0.167505         0.089113           -1.880           0.060
L4.heater            -0.130541         0.082232           -1.587           0.112
L5.ice cream         -0.206725         0.090337           -2.288           0.022
L5.heater            -0.168606         0.084980           -1.984           0.047
L6.ice cream         -0.138873         0.092630           -1.499           0.134
L6.heater            -0.115771         0.089911           -1.288           0.198
L7.ice cream         -0.180695         0.092245           -1.959           0.050
L7.heater            -0.027255         0.094850           -0.287           0.774
L8.ice cream         -0.111166         0.092679           -1.199           0.230
L8.heater             0.041803         0.094740            0.441           0.659
L9.ice cream         -0.043835         0.091389           -0.480           0.631
L9.heater             0.012616         0.094705            0.133           0.894
L10.ice cream        -0.153345         0.089841           -1.707           0.088
L10.heater            0.059215         0.094546            0.626           0.531
L11.ice cream        -0.004417         0.089771           -0.049           0.961
L11.heater            0.042153         0.093799            0.449           0.653
L12.ice cream        -0.126643         0.090094           -1.406           0.160
L12.heater           -0.021794         0.090097           -0.242           0.809
L13.ice cream        -0.081957         0.087069           -0.941           0.347
L13.heater           -0.018799         0.079199           -0.237           0.812
================================================================================

Results for equation heater
================================================================================
                   coefficient       std. error           t-stat            prob
--------------------------------------------------------------------------------
const                 0.005855         0.036062            0.162           0.871
L1.ice cream         -0.033113         0.084202           -0.393           0.694
L1.heater            -0.405367         0.077900           -5.204           0.000
L2.ice cream         -0.169804         0.092018           -1.845           0.065
L2.heater            -0.193569         0.084371           -2.294           0.022
L3.ice cream         -0.048999         0.095980           -0.511           0.610
L3.heater            -0.016958         0.085362           -0.199           0.843
L4.ice cream         -0.007633         0.094226           -0.081           0.935
L4.heater             0.009474         0.086950            0.109           0.913
L5.ice cream         -0.020253         0.095520           -0.212           0.832
L5.heater            -0.050607         0.089856           -0.563           0.573
L6.ice cream          0.040645         0.097944            0.415           0.678
L6.heater            -0.006504         0.095070           -0.068           0.945
L7.ice cream         -0.053440         0.097538           -0.548           0.584
L7.heater            -0.053795         0.100292           -0.536           0.592
L8.ice cream          0.074170         0.097997            0.757           0.449
L8.heater            -0.059001         0.100176           -0.589           0.556
L9.ice cream         -0.004720         0.096633           -0.049           0.961
L9.heater            -0.000168         0.100139           -0.002           0.999
L10.ice cream        -0.007920         0.094996           -0.083           0.934
L10.heater            0.040322         0.099970            0.403           0.687
L11.ice cream        -0.076564         0.094922           -0.807           0.420
L11.heater            0.022568         0.099181            0.228           0.820
L12.ice cream        -0.111959         0.095263           -1.175           0.240
L12.heater            0.082608         0.095266            0.867           0.386
L13.ice cream         0.203451         0.092065            2.210           0.027
L13.heater           -0.155390         0.083744           -1.856           0.064
================================================================================

Correlation matrix of residuals
             ice cream    heater
ice cream     1.000000  0.064855
heater        0.064855  1.000000
So our final model is:#
\[
\hat{h}_t = - 0.41h_{t-1} - 0.19h_{t-2} + 0.2i_{t-13}
\]