04- Conditional Value at Risk#
This setup code is required to run in an IPython notebook
%matplotlib inline
import matplotlib.pyplot as plt
import seaborn as sns

sns.set_style("darkgrid")
plt.rc("figure", figsize=(16, 6))
plt.rc("savefig", dpi=90)
plt.rc("font", family="sans-serif")
plt.rc("font", size=14)
Data#
These examples make use of S&P 500 data from Yahoo! that is available from arch.data.sp500.
import datetime as dt
import sys

import arch.data.sp500
import numpy as np
import pandas as pd
from arch import arch_model

data = arch.data.sp500.load()
market = data["Adj Close"]
returns = 100 * market.pct_change().dropna()
Value-at-Risk Forecasting#
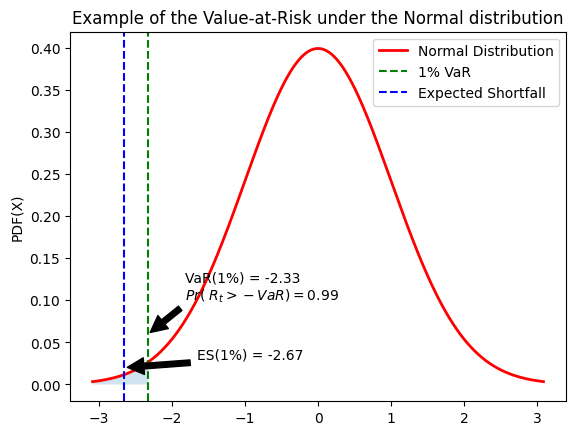
# Set the mean and standard deviation of the normal distribution
from scipy.stats import norm
mu = 0; sigma = 1
alpha = 0.01

# Generate 1000 random values from the normal distribution
x = np.linspace(norm.ppf(0.001, mu, sigma), norm.ppf(0.999, mu, sigma), 1000)
# Calculate the 5% value at risk (VaR)
VaR = norm.ppf(alpha, mu, sigma)
# Value-at Risk
ES = norm.pdf(norm.ppf(alpha))/alpha

# Plot the normal distribution
plt.plot(x, norm.pdf(x, mu, sigma), 'r-', lw=2, label='Normal Distribution')


x_fill = np.linspace(norm.ppf(0.001, mu, sigma), VaR, 100)
plt.fill_between(x_fill, norm.pdf(x_fill, mu, sigma), alpha=0.2)

# Add a vertical line and annotation for the VaR value
plt.axvline(x=VaR, color='g', linestyle='--', label=f'{int(alpha*100)}% VaR')
plt.annotate(f'VaR({int(alpha*100)}%) = {VaR:.2f}\n$Pr(~R_t>-VaR) = {1-alpha}$', xy=(VaR, 0.06), xytext=(VaR + 0.5, 0.1),
             arrowprops=dict(facecolor='black', shrink=0.05))

# Add a vertical line and annotation for the ES value
plt.axvline(x=-ES, color='b', linestyle='--', label='Expected Shortfall')
plt.annotate(f'ES({int(alpha*100)}%) = {-ES:.2f}', xy=(-ES, 0.02), xytext=(-ES +1, 0.03),
             arrowprops=dict(facecolor='black', shrink=0.05))

plt.legend(loc='best')
plt.ylabel('PDF(X)')
plt.title('Example of the Value-at-Risk under the Normal distribution')
# Show the plot
plt.show()

Exercise 1:
Computer the 5% Value at Risk
Value-at-Risk (VaR) forecasts from GARCH models depend on the conditional mean, the conditional volatility and the quantile of the standardized residuals,
where \(q_{\alpha}\) is the \(\alpha\) quantile of the standardized residuals, e.g., 5%.
The quantile can be either computed from the estimated model density or computed using the empirical distribution of the standardized residuals. The example below shows both methods.
am = arch_model(returns, vol="Garch", p=1, o=0, q=1, dist="skewt")
res = am.fit(disp="off", last_obs="2017-12-31")
Parametric VaR#
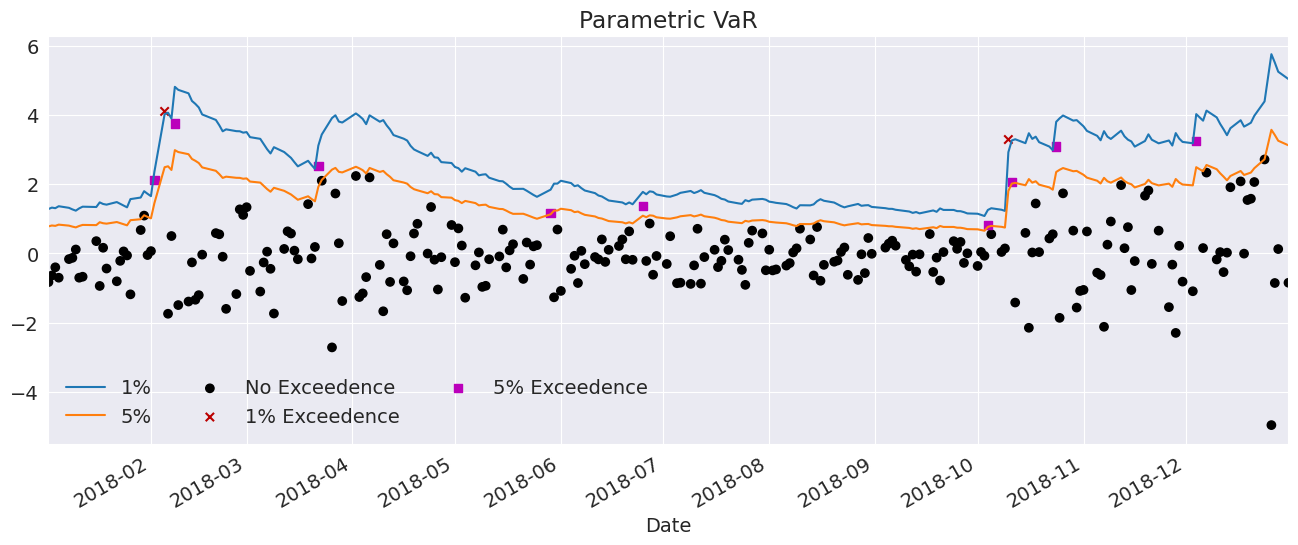
First, we use the model to estimate the VaR. The quantiles can be computed using the ppf method of the distribution attached to the model. The quantiles are printed below.
forecasts = res.forecast(start="2018-1-1", reindex=False)
cond_mean = forecasts.mean["2018":]
cond_var = forecasts.variance["2018":]
q = am.distribution.ppf([0.01, 0.05], res.params[-2:])
print(q)
[-2.64484859 -1.6496597 ]
Next, we plot the two VaRs along with the returns. The returns that violate the VaR forecasts are highlighted.
value_at_risk = -cond_mean.values - np.sqrt(cond_var).values * q[None, :]
value_at_risk = pd.DataFrame(value_at_risk, columns=["1%", "5%"], index=cond_var.index)
ax = value_at_risk.plot(legend=False)
xl = ax.set_xlim(value_at_risk.index[0], value_at_risk.index[-1])
rets_2018 = returns["2018":].copy()
rets_2018.name = "S&P 500 Return"
c = []
for idx in value_at_risk.index:
    if rets_2018[idx] > -value_at_risk.loc[idx, "5%"]:
        c.append("#000000")
    elif rets_2018[idx] < -value_at_risk.loc[idx, "1%"]:
        c.append("#BB0000")
    else:
        c.append("#BB00BB")
c = np.array(c, dtype="object")
labels = {
    "#BB0000": "1% Exceedence",
    "#BB00BB": "5% Exceedence",
    "#000000": "No Exceedence",
}
markers = {"#BB0000": "x", "#BB00BB": "s", "#000000": "o"}
for color in np.unique(c):
    sel = c == color
    ax.scatter(
        rets_2018.index[sel],
        -rets_2018.loc[sel],
        marker=markers[color],
        c=c[sel],
        label=labels[color],
    )
ax.set_title("Parametric VaR")
leg = ax.legend(frameon=False, ncol=3)

Filtered Historical Simulation#
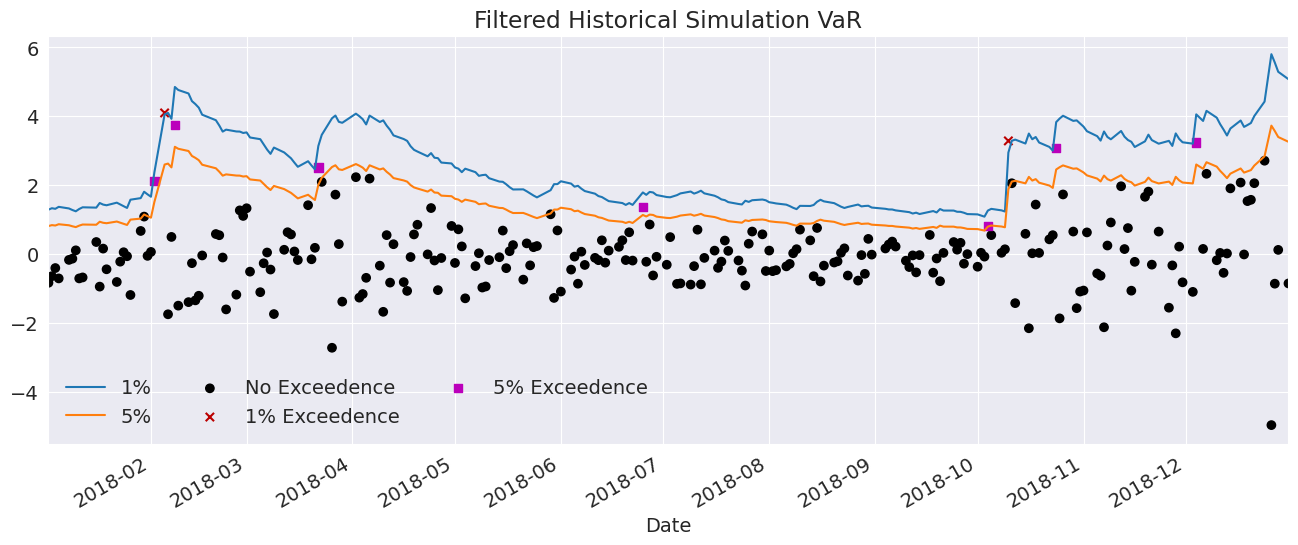
Next, we use the empirical distribution of the standardized residuals to estimate the quantiles. These values are very similar to those estimated using the assumed distribution. The plot below is identical except for the slightly different quantiles.
std_rets = (returns[:"2017"] - res.params["mu"]) / res.conditional_volatility
std_rets = std_rets.dropna()
q = std_rets.quantile([0.01, 0.05])
print(q)
0.01   -2.668273
0.05   -1.723353
dtype: float64
value_at_risk = -cond_mean.values - np.sqrt(cond_var).values * q.values[None, :]
value_at_risk = pd.DataFrame(value_at_risk, columns=["1%", "5%"], index=cond_var.index)
ax = value_at_risk.plot(legend=False)
xl = ax.set_xlim(value_at_risk.index[0], value_at_risk.index[-1])
rets_2018 = returns["2018":].copy()
rets_2018.name = "S&P 500 Return"
c = []
for idx in value_at_risk.index:
    if rets_2018[idx] > -value_at_risk.loc[idx, "5%"]:
        c.append("#000000")
    elif rets_2018[idx] < -value_at_risk.loc[idx, "1%"]:
        c.append("#BB0000")
    else:
        c.append("#BB00BB")
c = np.array(c, dtype="object")
for color in np.unique(c):
    sel = c == color
    ax.scatter(
        rets_2018.index[sel],
        -rets_2018.loc[sel],
        marker=markers[color],
        c=c[sel],
        label=labels[color],
    )
ax.set_title("Filtered Historical Simulation VaR")
leg = ax.legend(frameon=False, ncol=3)

import numpy as np import matplotlib.pyplot as plt from scipy.stats import norm, t, skewnorm, gennorm
Set random seed for reproducibility#
np.random.seed(1234)
Generate data from different distributions#
x_norm = np.linspace(norm.ppf(0.001), norm.ppf(0.999), 100) y_norm = norm.pdf(x_norm, loc=0, scale=1)
x_t = np.linspace(t.ppf(0.01, df=3), t.ppf(0.99, df=3), 100) y_t = t.pdf(x_t, df=3, loc=0, scale=1)
x_skewt = np.linspace(skewnorm.ppf(0.001, a=4), skewnorm.ppf(0.999, a=4), 100) y_skewt = skewnorm.pdf(x_skewt, a=4, loc=0, scale=1)
x_ged = np.linspace(gennorm.ppf(0.001, beta=2, loc=0, scale=1), gennorm.ppf(0.999, beta=2, loc=0, scale=1), 100) y_ged = gennorm.pdf(x_ged, beta=2, loc=0, scale=1)
Plot the distributions#
fig, ax = plt.subplots(figsize=(8, 5))
ax.plot(x_norm, y_norm, ‘b-’, lw=2, label=‘Normal’) ax.plot(x_t, y_t, ‘g-’, lw=2, label=‘Student t’) ax.plot(x_skewt, y_skewt, ‘r-’, lw=2, label=‘Skewed Student t’) ax.plot(x_ged, y_ged, ‘m-’, lw=2, label=‘GED’)
ax.legend(loc=‘best’) ax.set_xlabel(‘X’) ax.set_ylabel(‘Density’) ax.set_title(‘Most used Distributions’) plt.show()

